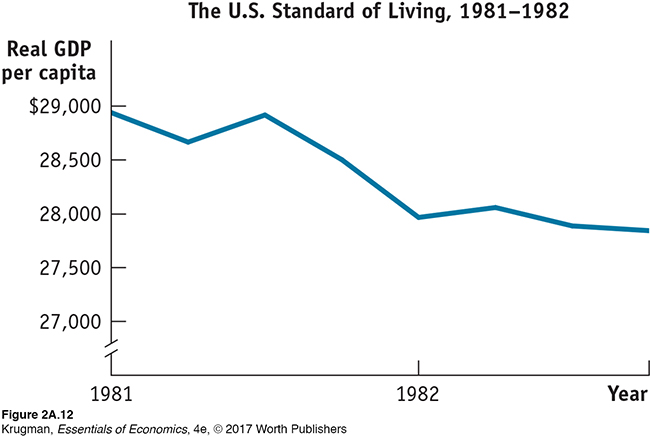
FIGURE2A-12Interpreting Graphs: The Effect of Scale
Some of the same data for the years 1981 and 1982 used in Figure 2A-8 are represented here, except that here they are shown using increments of $500 rather than increments of $10,000. As a result of this change in scale, changes in the standard of living look much larger in this figure compared to Figure 2A-8.