FIGURE 10-6 A Public Good
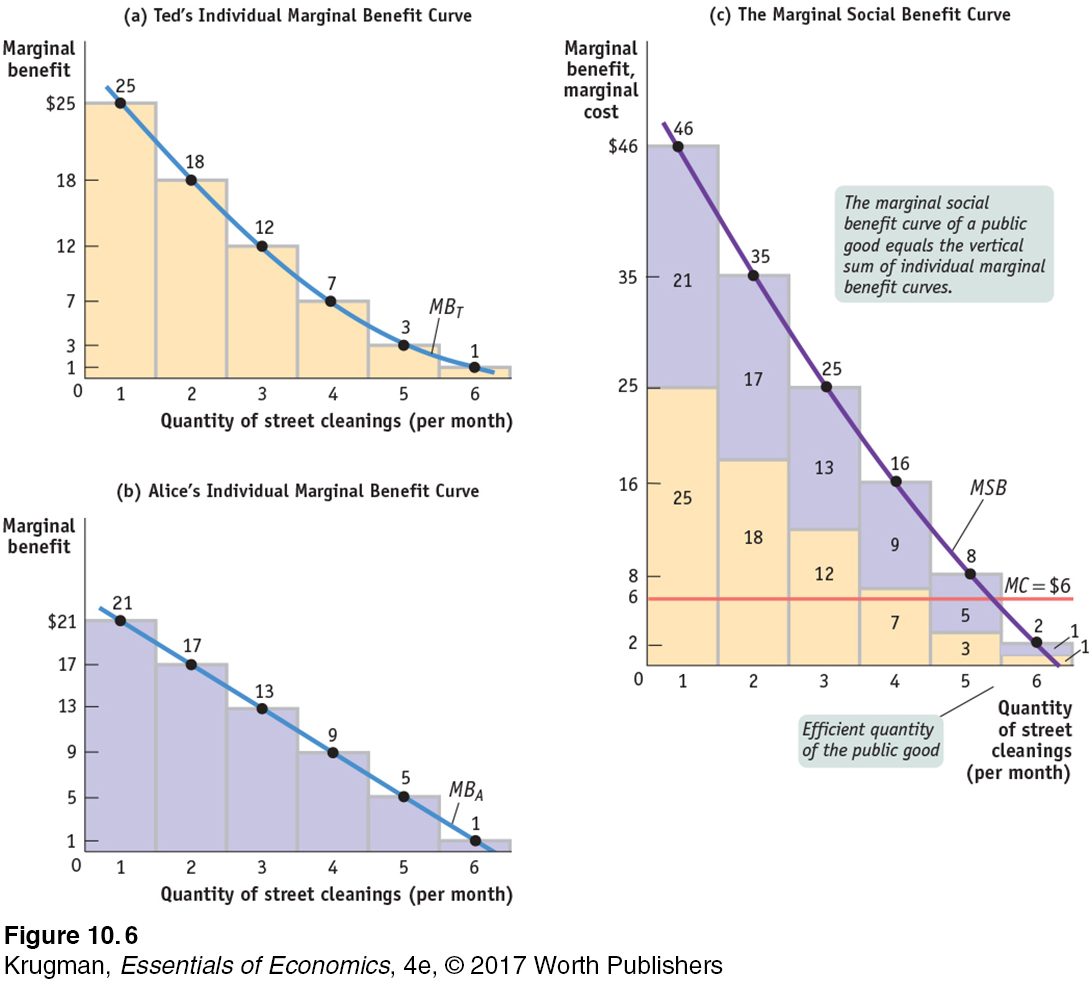 Panel (a) shows Ted’s individual marginal benefit curve of street cleanings per month, MBT, and panel (b) shows Alice’s individual marginal benefit curve, MBA. Panel (c) shows the marginal social benefit of the public good, equal to the sum of the individual marginal benefits to all consumers (in this case, Ted and Alice). The marginal social benefit curve, MSB, is the vertical sum of the individual marginal benefit curves MBT and MBA. At a constant marginal cost of $6, there should be 5 street cleanings per month, because the marginal social benefit of going from 4 to 5 cleanings is $8 ($3 for Ted plus $5 for Alice), but the marginal social benefit of going from 5 to 6 cleanings is only $2.