FIGURE 14-5 Growth and Changes in Unemployment, 1949–2015
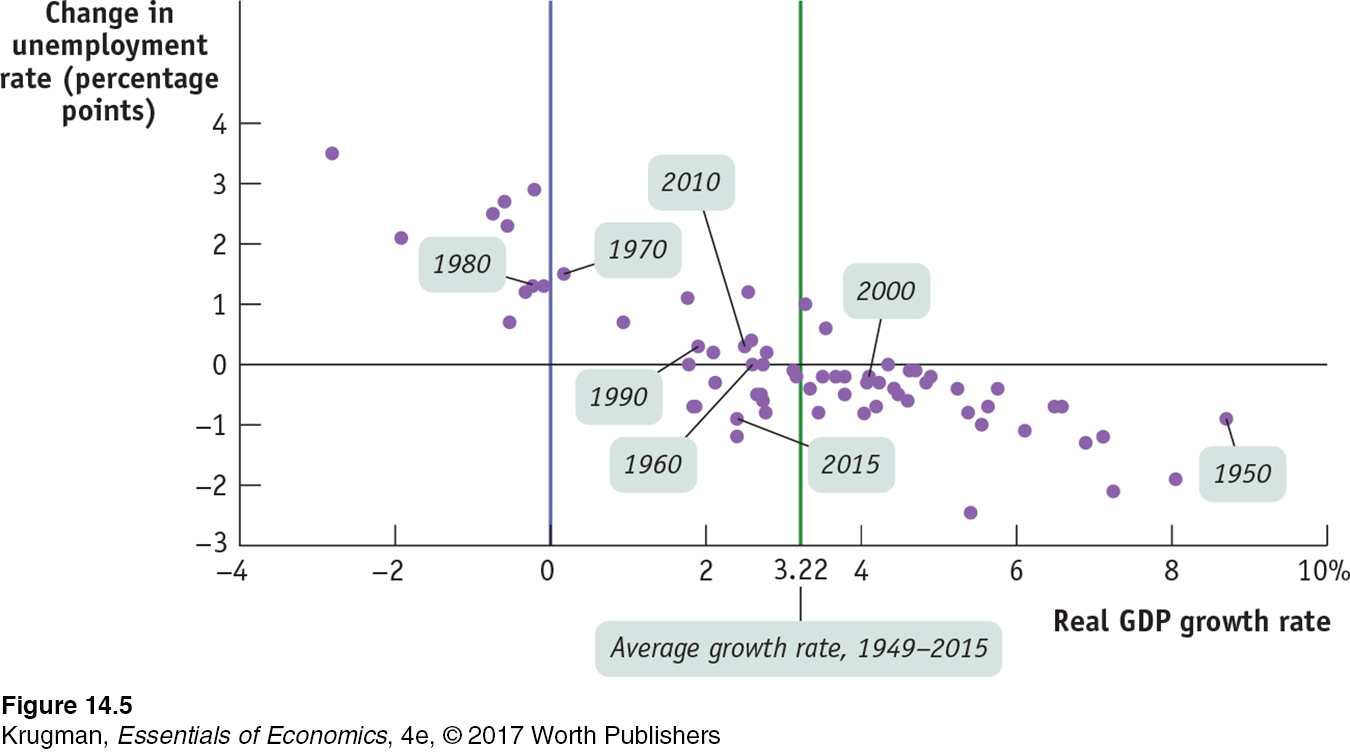 Each dot shows the growth rate of the economy and the change in the unemployment rate for a specific year between 1949 and 2015. For example, in 2000 the economy grew 4.1% and the unemployment rate fell 0.2 percentage points, from 4.2% to 4.0%. In general, the unemployment rate fell when growth was above its average rate of 3.22% a year and rose when growth was below average. Unemployment always rose when real GDP fell.
Data from: Bureau of Labor Statistics; Bureau of Economic Analysis.