FIGURE 14-12 The Cost of Disinflation
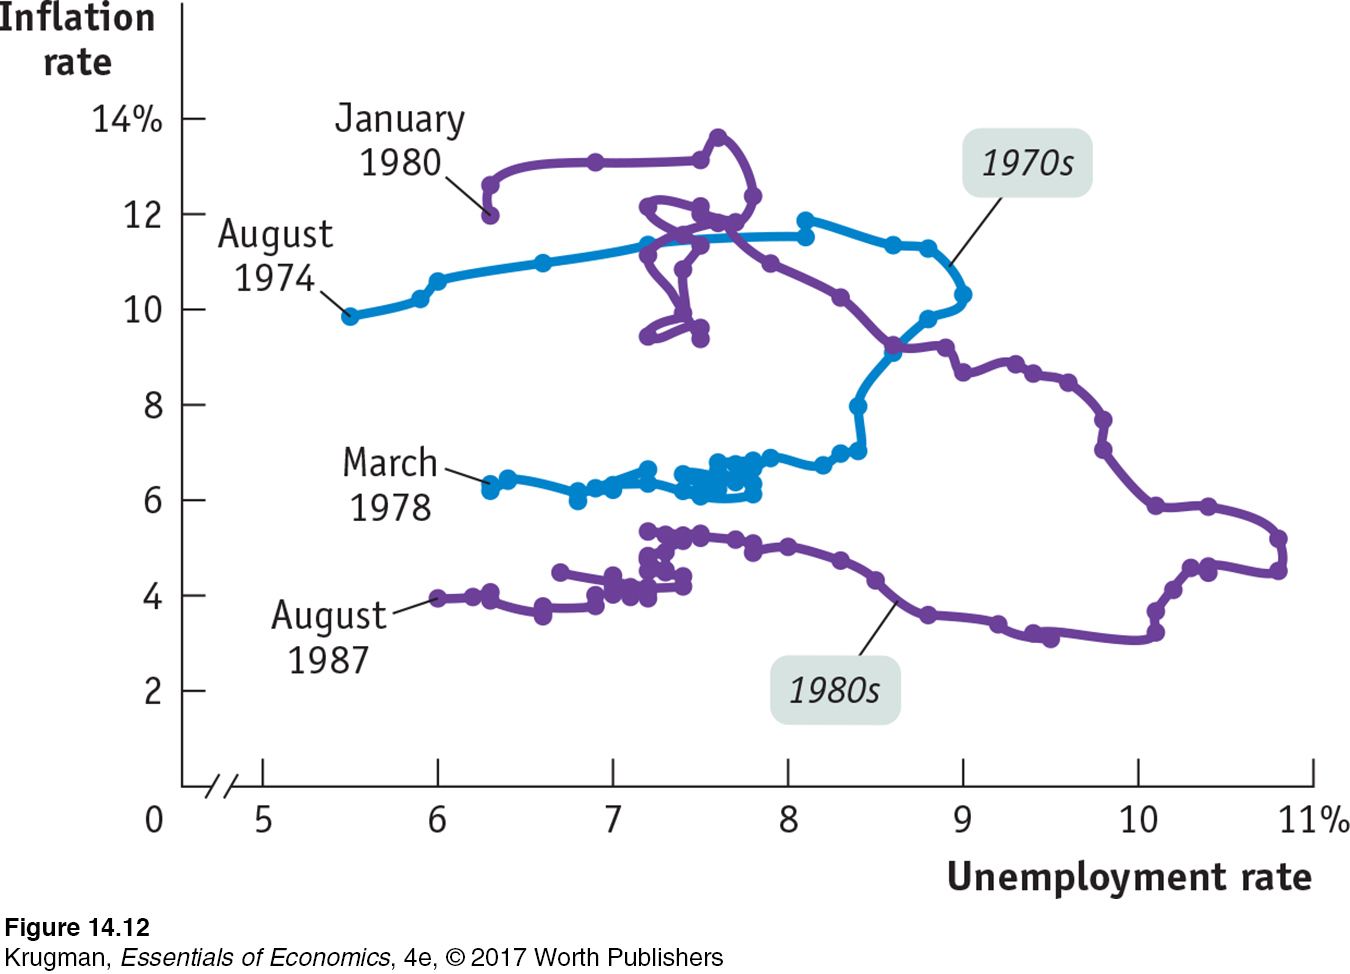 There were two major periods of disinflation in modern U.S. history, in the mid-1970s and the early 1980s. This figure shows the track of the unemployment rate and the “core” inflation rate, which excludes food and energy, during these two episodes. In each case bringing inflation down required a temporary but very large increase in the unemployment rate, demonstrating the high cost of disinflation.
Data from: Bureau of Labor Statistics.