FIGURE 16-1 The Aggregate Demand Curve
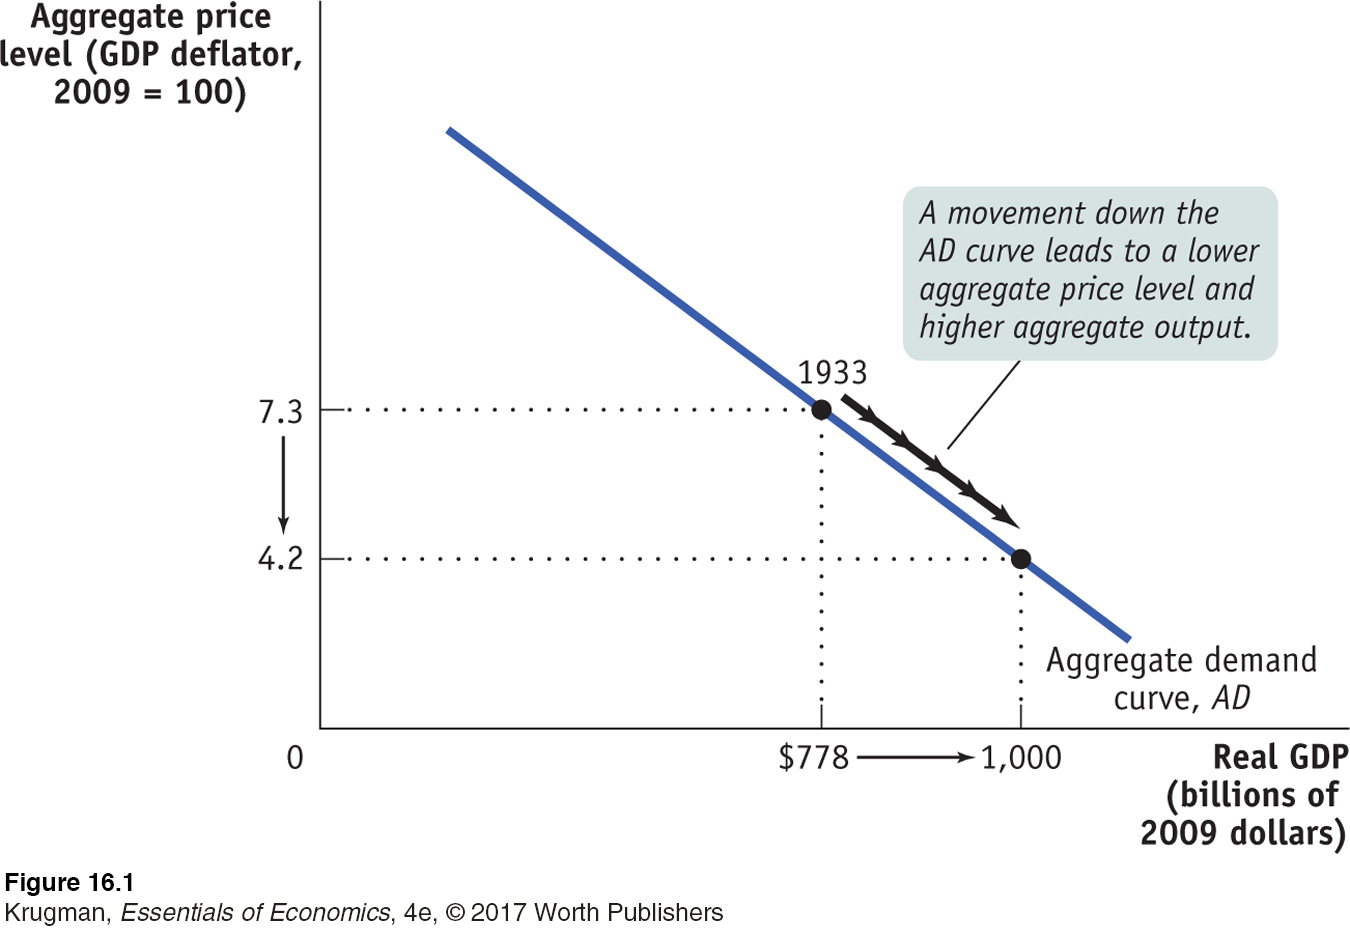 The aggregate demand curve shows the relationship between the aggregate price level and the quantity of aggregate output demanded. The curve is downward sloping due to the wealth effect of a change in the aggregate price level and the interest rate effect of a change in the aggregate price level. Corresponding to the actual 1933 data, here the total quantity of goods and services demanded at an aggregate price level of 7.3 is $778 billion in 2009 dollars. According to our hypothetical curve, however, if the aggregate price level had been only 4.2, the quantity of aggregate output demanded would have risen to $1,000 billion.