FIGURE 16-5 The Long-Run Aggregate Supply Curve
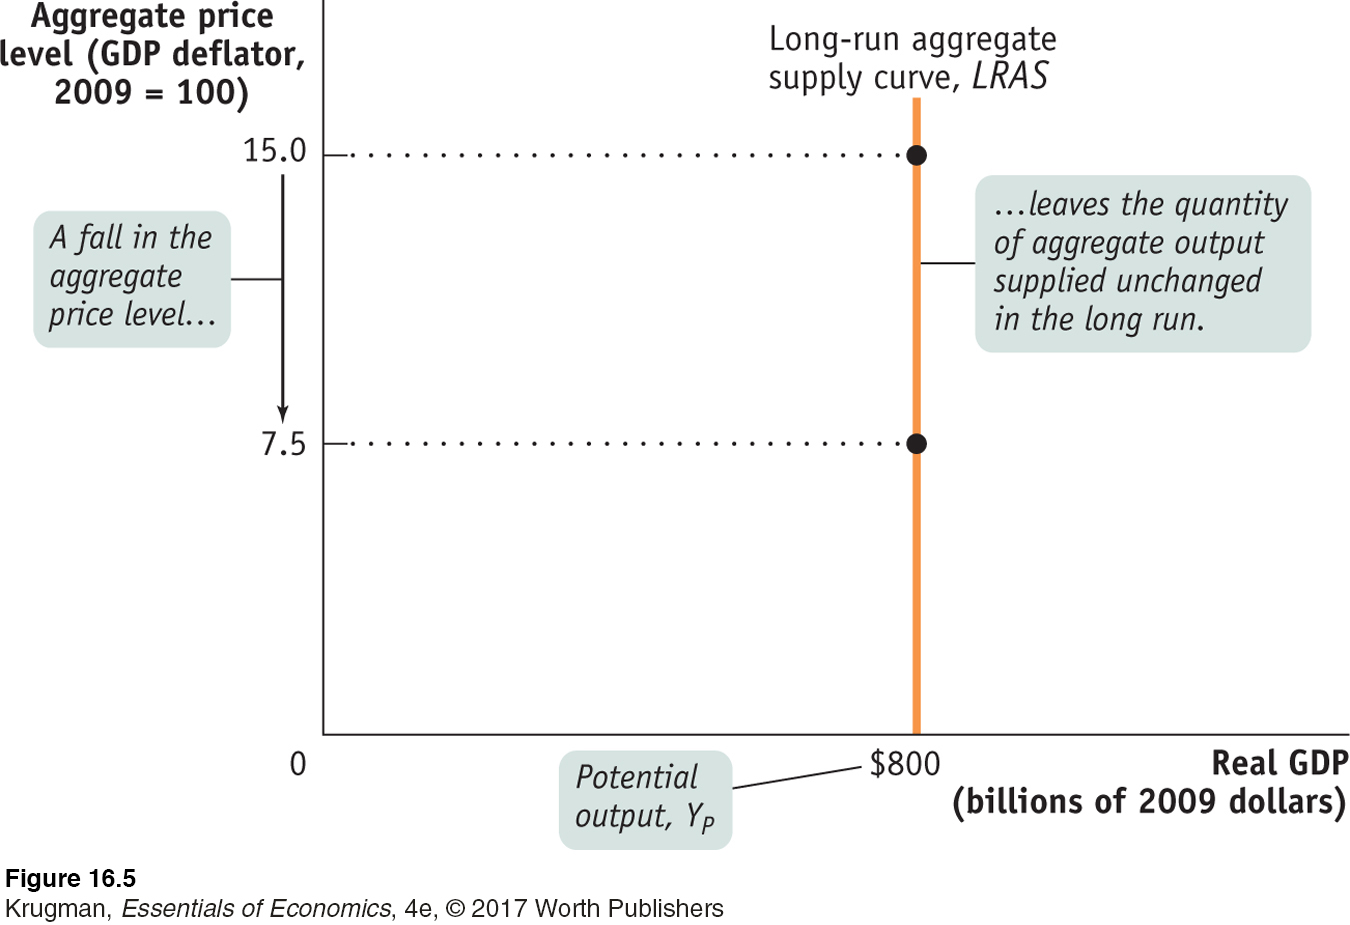 The long-run aggregate supply curve shows the quantity of aggregate output supplied when all prices, including nominal wages, are flexible. It is vertical at potential output, YP, because in the long run a change in the aggregate price level has no effect on the quantity of aggregate output supplied.