Question 20.1
1. In the United States, the opportunity cost of 1 ton of corn is 50 bicycles. In China, the opportunity cost of 1 bicycle is 0.01 ton of corn.
Determine the pattern of comparative advantage.
To determine comparative advantage, we must compare the two countries’ opportunity costs for a given good. Take the opportunity cost of 1 ton of corn in terms of bicycles. In China, the opportunity cost of 1 bicycle is 0.01 ton of corn; so the opportunity cost of 1 ton of corn is 1/0.01 bicycles = 100 bicycles. The United States has the comparative advantage in corn since its opportunity cost in terms of bicycles is 50, a smaller number. Similarly, the opportunity cost in the United States of 1 bicycle in terms of corn is 1/50 ton of corn = 0.02 ton of corn. This is greater than 0.01, the Chinese opportunity cost of 1 bicycle in terms of corn, implying that China has a comparative advantage in bicycles.
In autarky, the United States can produce 200,000 bicycles if no corn is produced, and China can produce 3,000 tons of corn if no bicycles are produced. Draw each country’s production possibility frontier assuming constant opportunity cost, with tons of corn on the vertical axis and bicycles on the horizontal axis.
Given that the United States can produce 200,000 bicycles if no corn is produced, it can produce 200,000 bicycles × 0.02 ton of corn/bicycle = 4,000 tons of corn when no bicycles are produced. Likewise, if China can produce 3,000 tons of corn if no bicycles are produced, it can produce 3,000 tons of corn × 100 bicycles/ton of corn = 300,000 bicycles if no corn is produced. These points determine the vertical and horizontal intercepts of the U.S. and Chinese production possibility frontiers, as shown in the accompanying diagram.
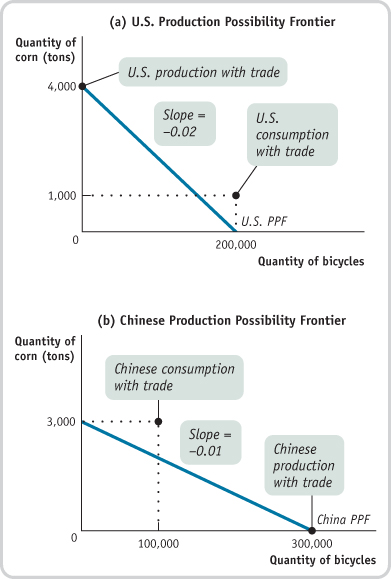
With trade, each country specializes its production. The United States consumes 1,000 tons of corn and 200,000 bicycles; China consumes 3,000 tons of corn and 100,000 bicycles. Indicate the production and consumption points on your diagrams, and use them to explain the gains from trade.
The diagram shows the production and consumption points of the two countries. Each country is clearly better off with international trade because each now consumes a bundle of the two goods that lies outside its own production possibility frontier, indicating that these bundles were unattainable in autarky.