Figure 3.2: FIGURE 3-2An Increase in Demand
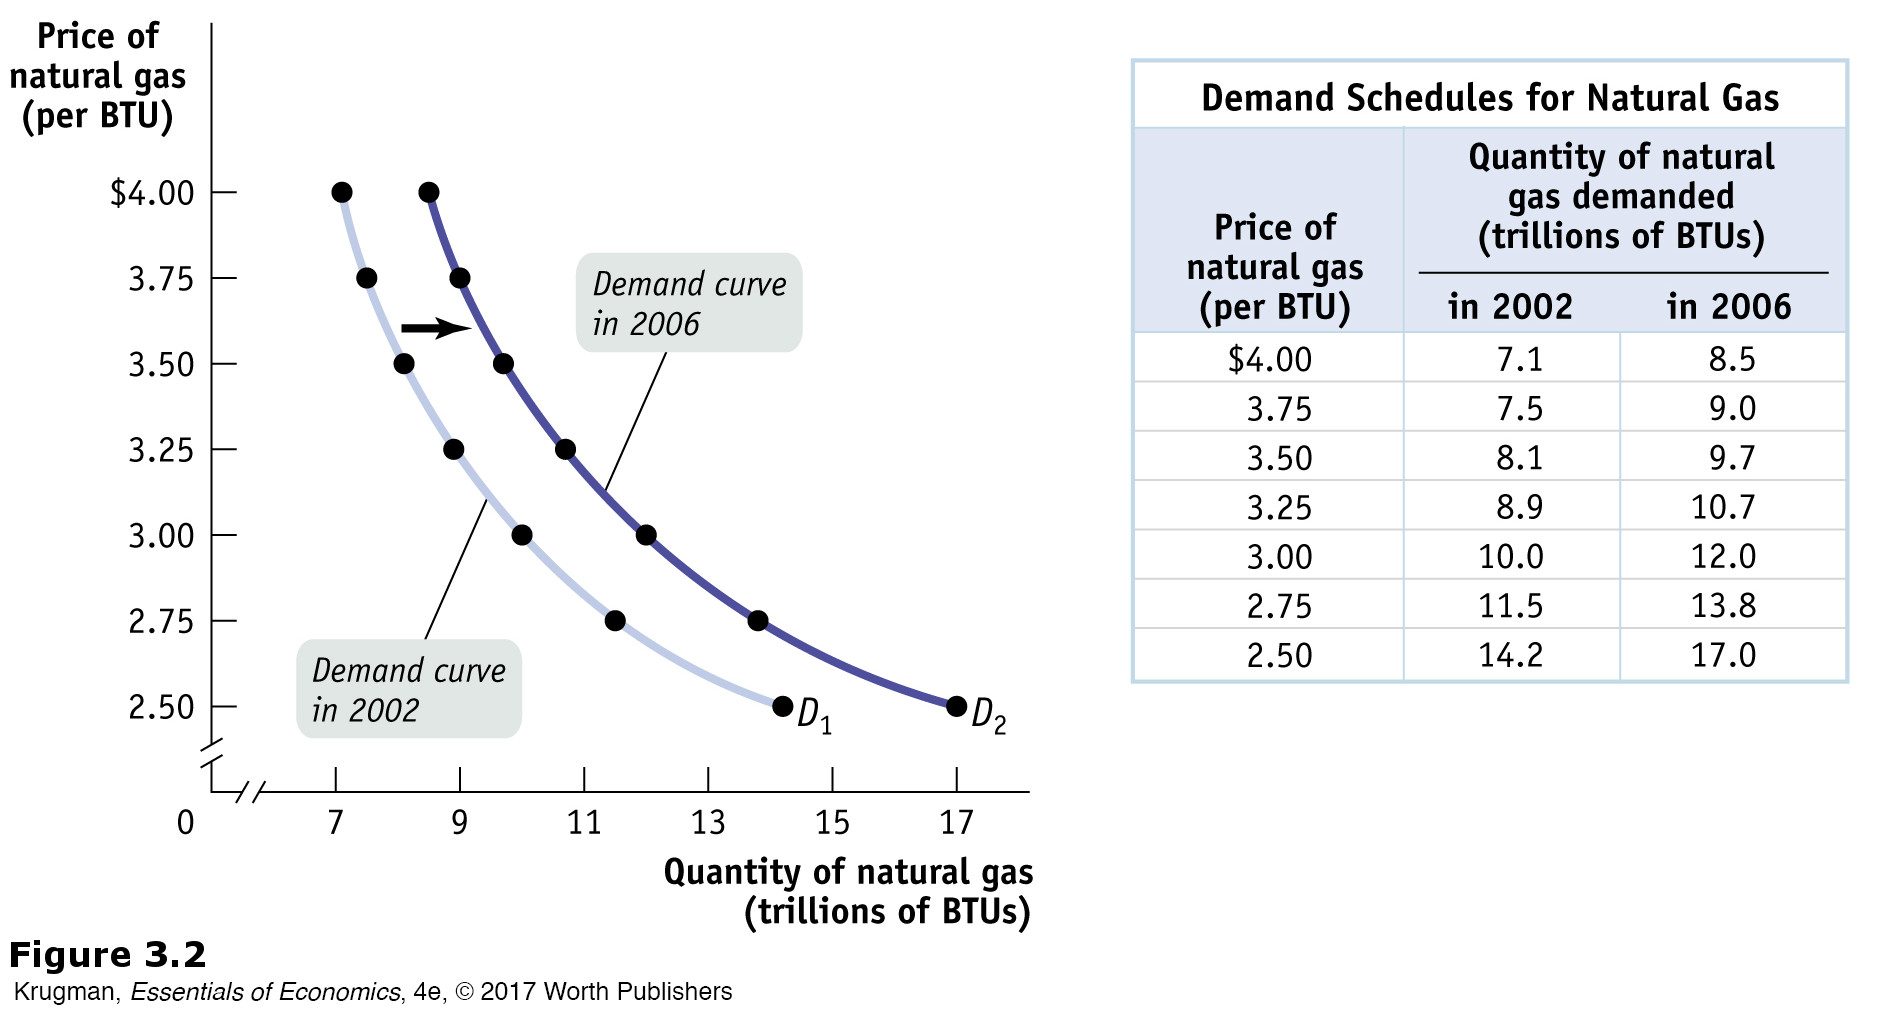
Figure 3.2: A strong economy is one factor that increases the demand for natural gas—a rise in the quantity demanded at any given price. This is represented by the two demand schedules—one showing the demand in 2002 when the economy was weak, the other showing the demand in 2006, when the economy was strong—and their corresponding demand curves. The increase in demand shifts the demand curve to the right.