Figure 3.6: FIGURE 3-6 The Supply Schedule and the Supply Curve
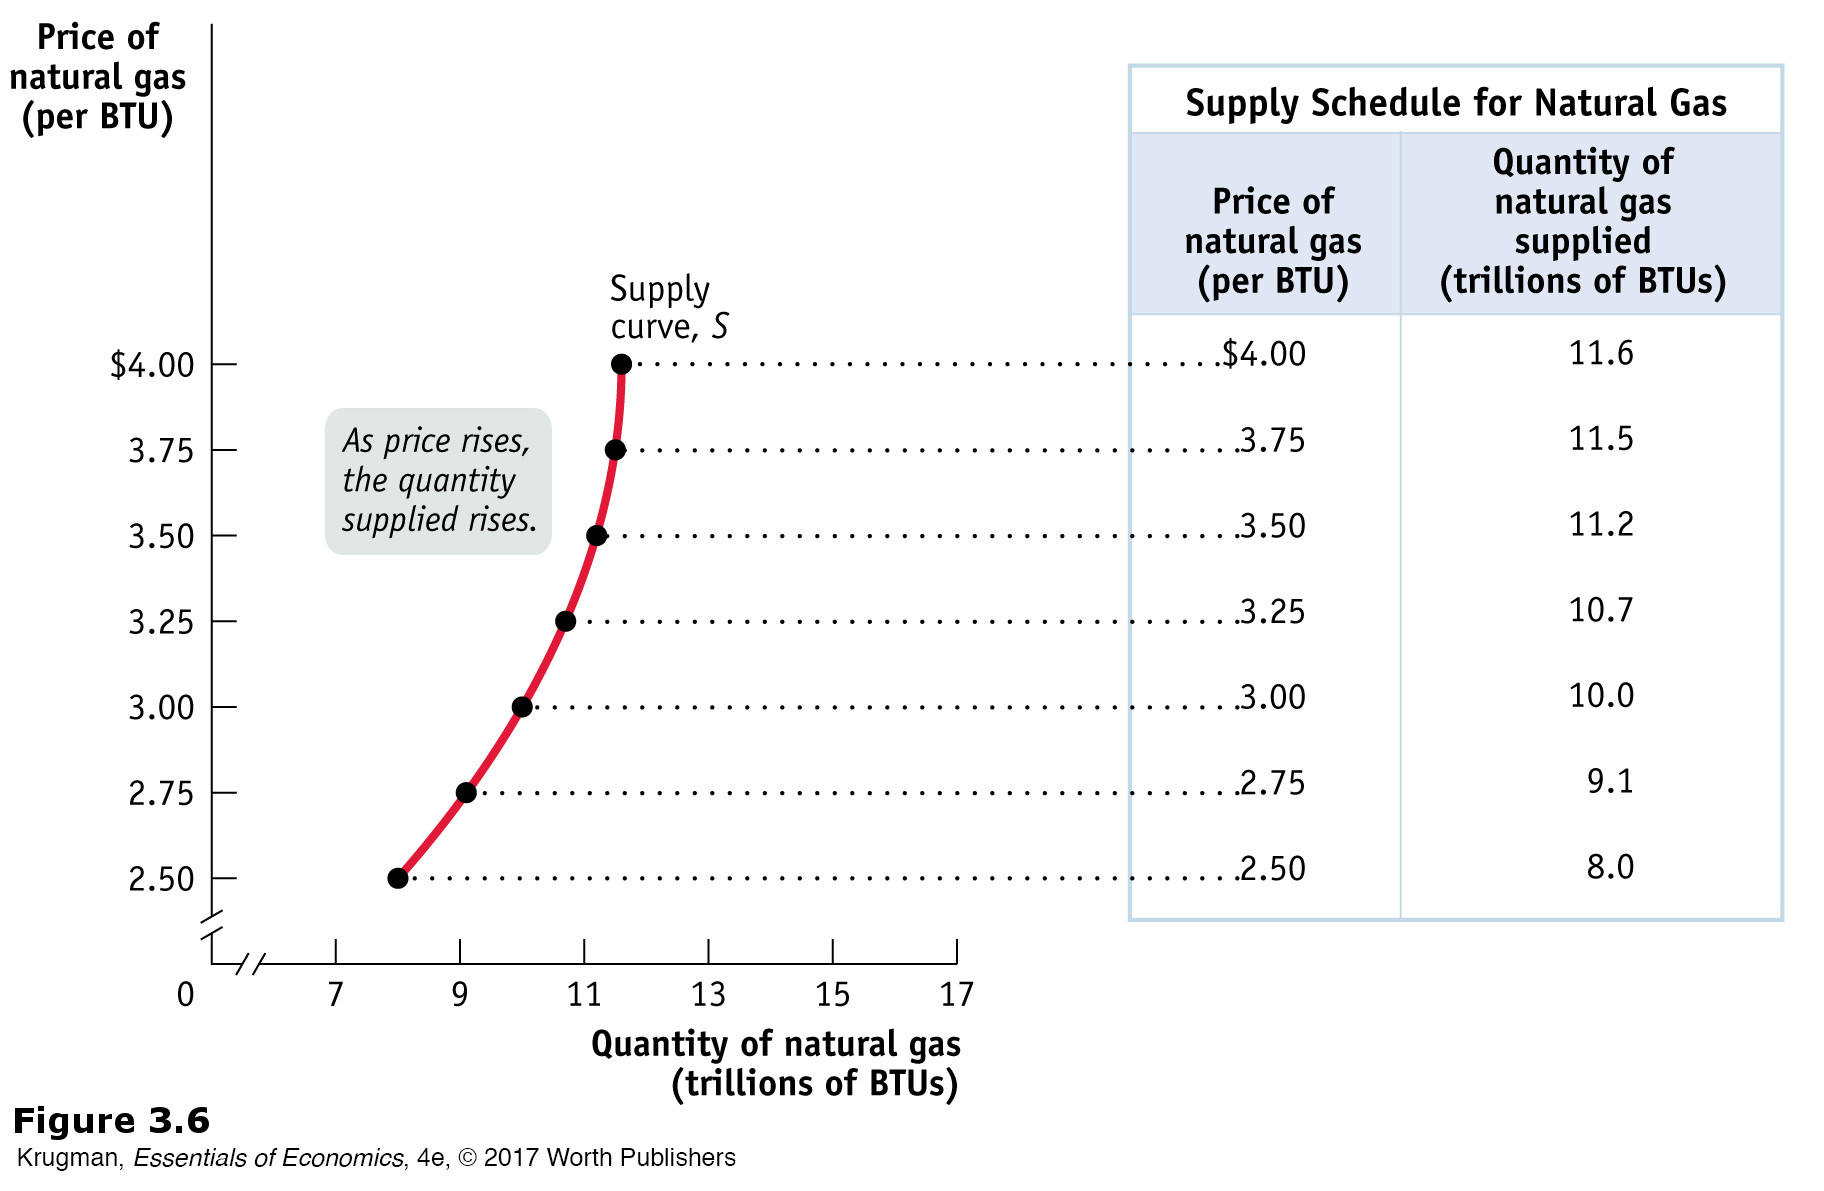
Figure 3.6: The supply schedule for natural gas is plotted to yield the corresponding supply curve, which shows how much of a good producers are willing to sell at any given price. The supply curve and the supply schedule reflect the fact that supply curves are usually upward sloping: the quantity supplied rises when the price rises.