Figure 3.7: FIGURE 3-7 An Increase in Supply
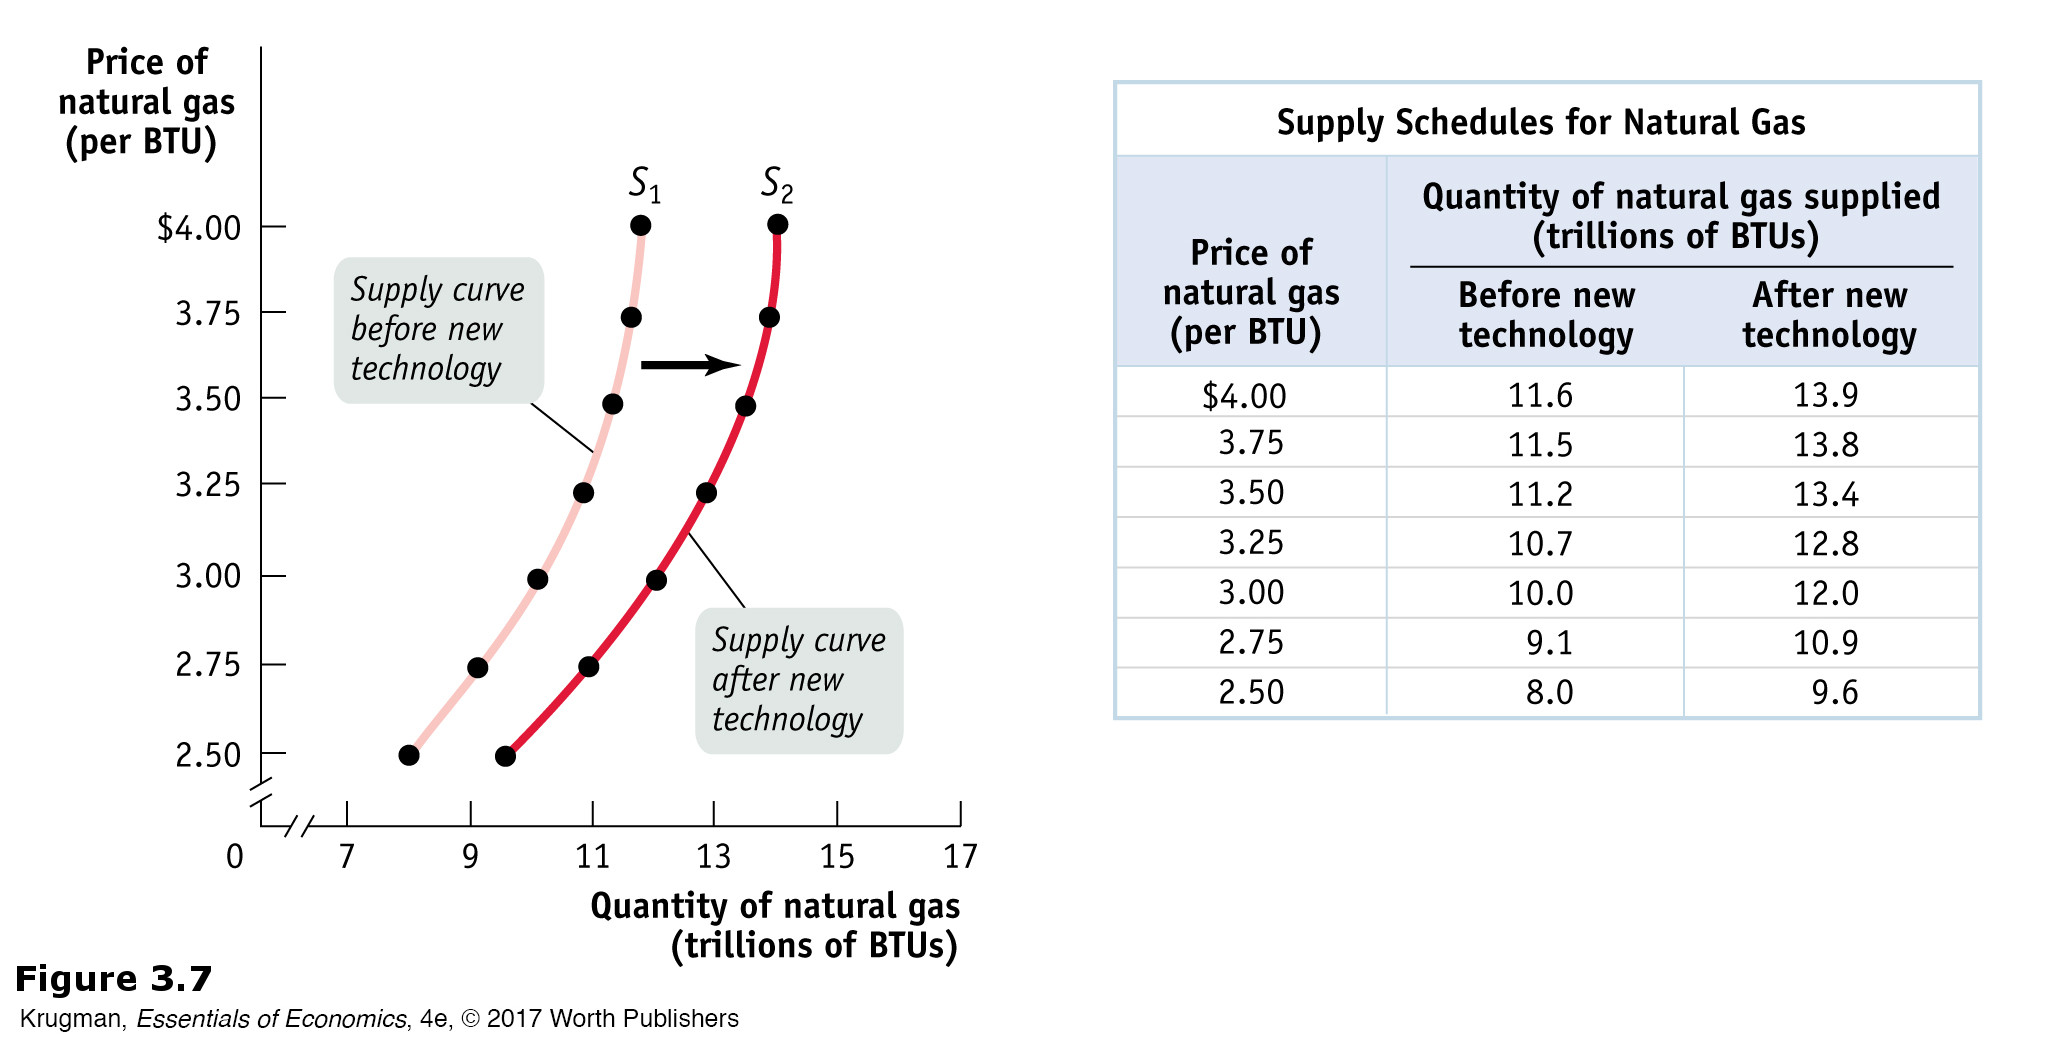
Figure 3.7: The adoption of improved natural gas–drilling technology generated an increase in supply—a rise in the quantity supplied at any given price. This event is represented by the two supply schedules—one showing supply before the new technology was adopted, the other showing supply after the new technology was adopted—and their corresponding supply curves. The increase in supply shifts the supply curve to the right.