Figure 3.8: FIGURE 3-8 Movement Along the Supply Curve versus Shift of the Supply Curve
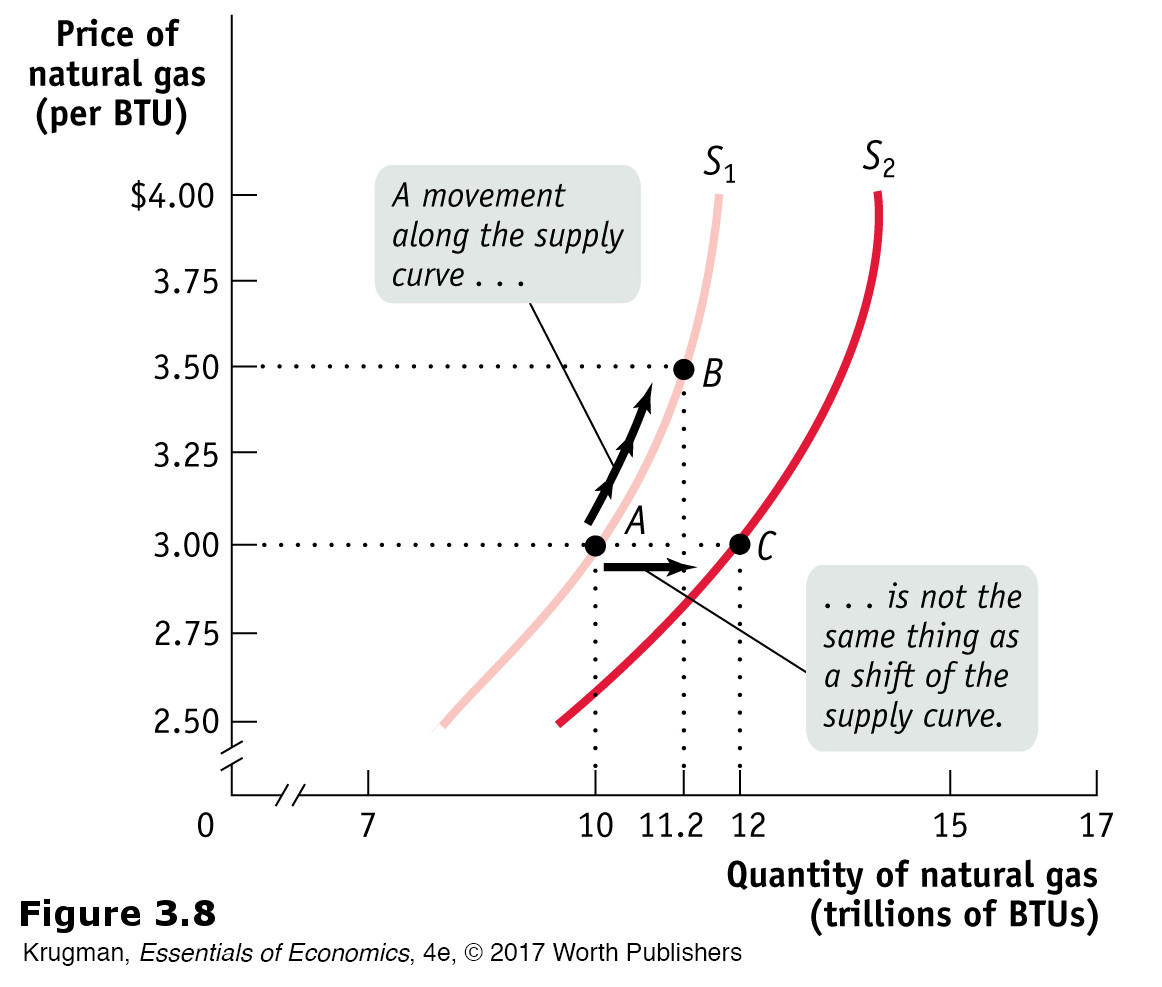
Figure 3.8: The increase in quantity supplied when going from point A to point B reflects a movement along the supply curve: it is the result of a rise in the price of the good. The increase in quantity supplied when going from point A to point C reflects a shift of the supply curve: it is the result of an increase in the quantity supplied at any given price.