Figure 3.10: FIGURE 3-10 The Individual Supply Curve and the Market Supply Curve
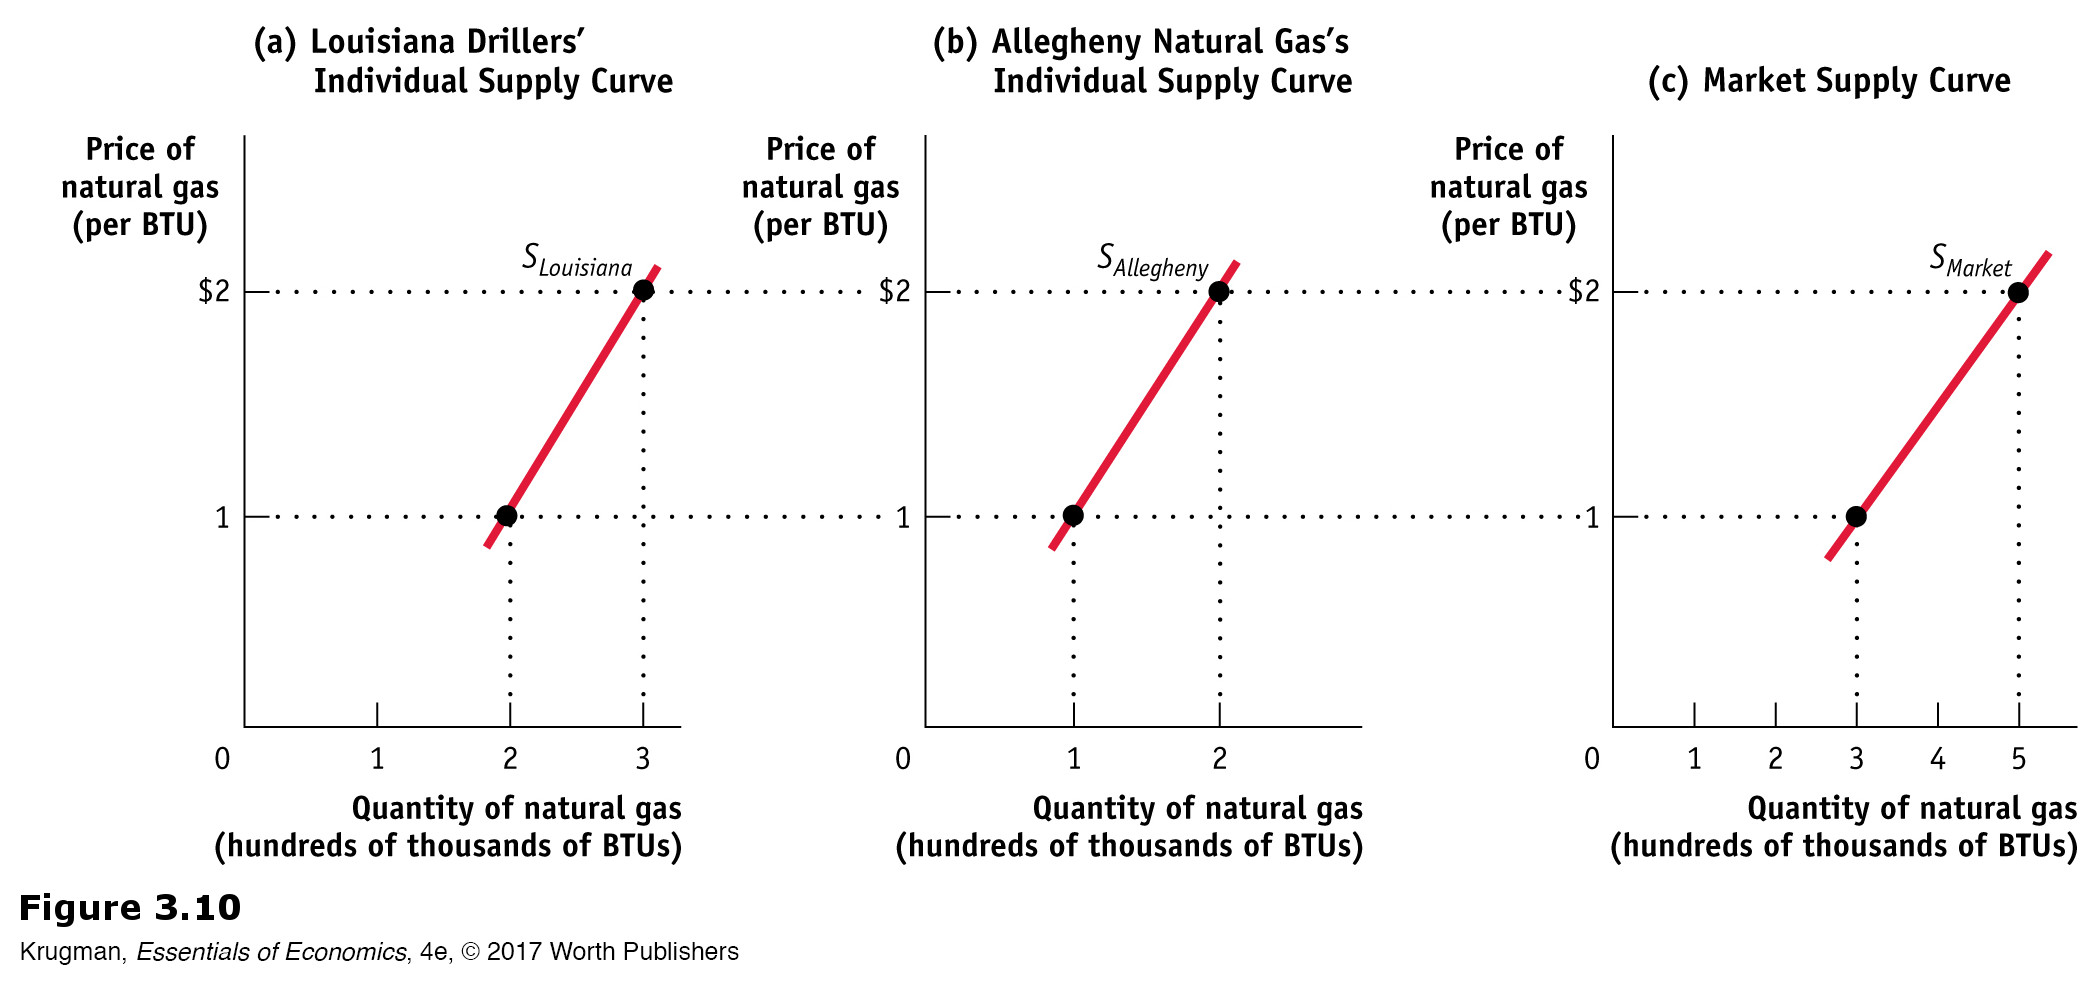
Figure 3.10: Panel (a) shows the individual supply curve for Louisiana Drillers, SLouisiana, the quantity it will sell at any given price. Panel (b) shows the individual supply curve for Allegheny Natural Gas, SAllegheny. The market supply curve, which shows the quantity of natural gas supplied by all producers at any given price is shown in panel (c). The market supply curve is the horizontal sum of the individual supply curves of all producers.