Figure 3.11: FIGURE 3-11 Market Equilibrium
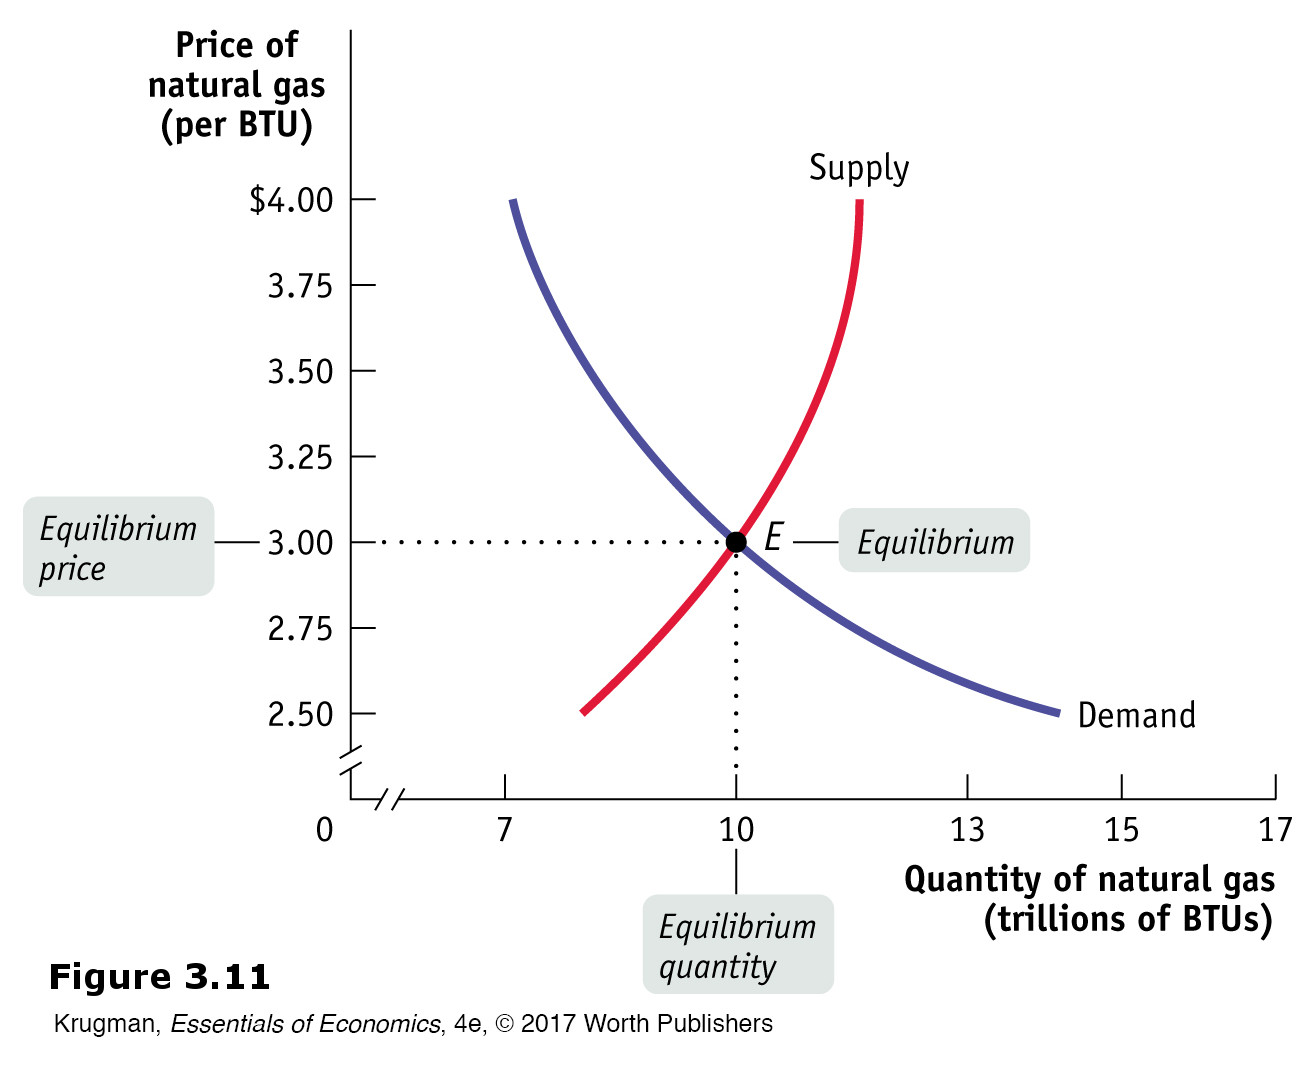
Figure 3.11: Market equilibrium occurs at point E, where the supply curve and the demand curve intersect. In equilibrium, the quantity demanded is equal to the quantity supplied. In this market, the equilibrium price is $3 per BTU and the equilibrium quantity is 10 trillion BTUs per year.