Figure 3.15: FIGURE 3-15 Equilibrium and Shifts of the Supply Curve
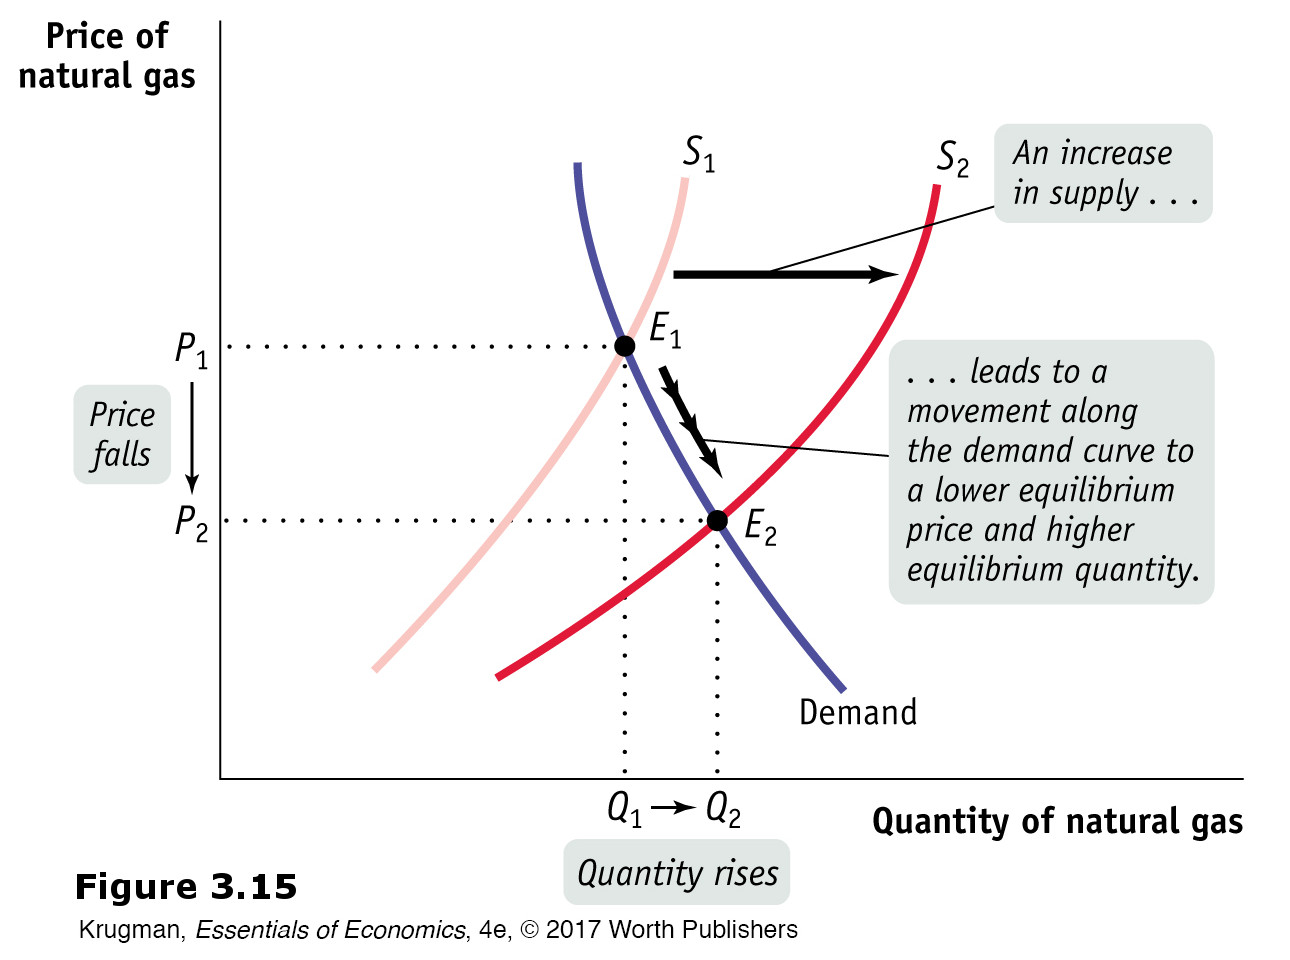
Figure 3.15: The original equilibrium in the market is at E1. Improved technology causes an increase in the supply of natural gas and shifts the supply curve rightward from S1 to S2. A new equilibrium is established at E2, with a lower equilibrium price, P2, and a higher equilibrium quantity, Q2.