Figure 3.16: FIGURE 3-16 Simultaneous Shifts of the Demand and Supply Curves
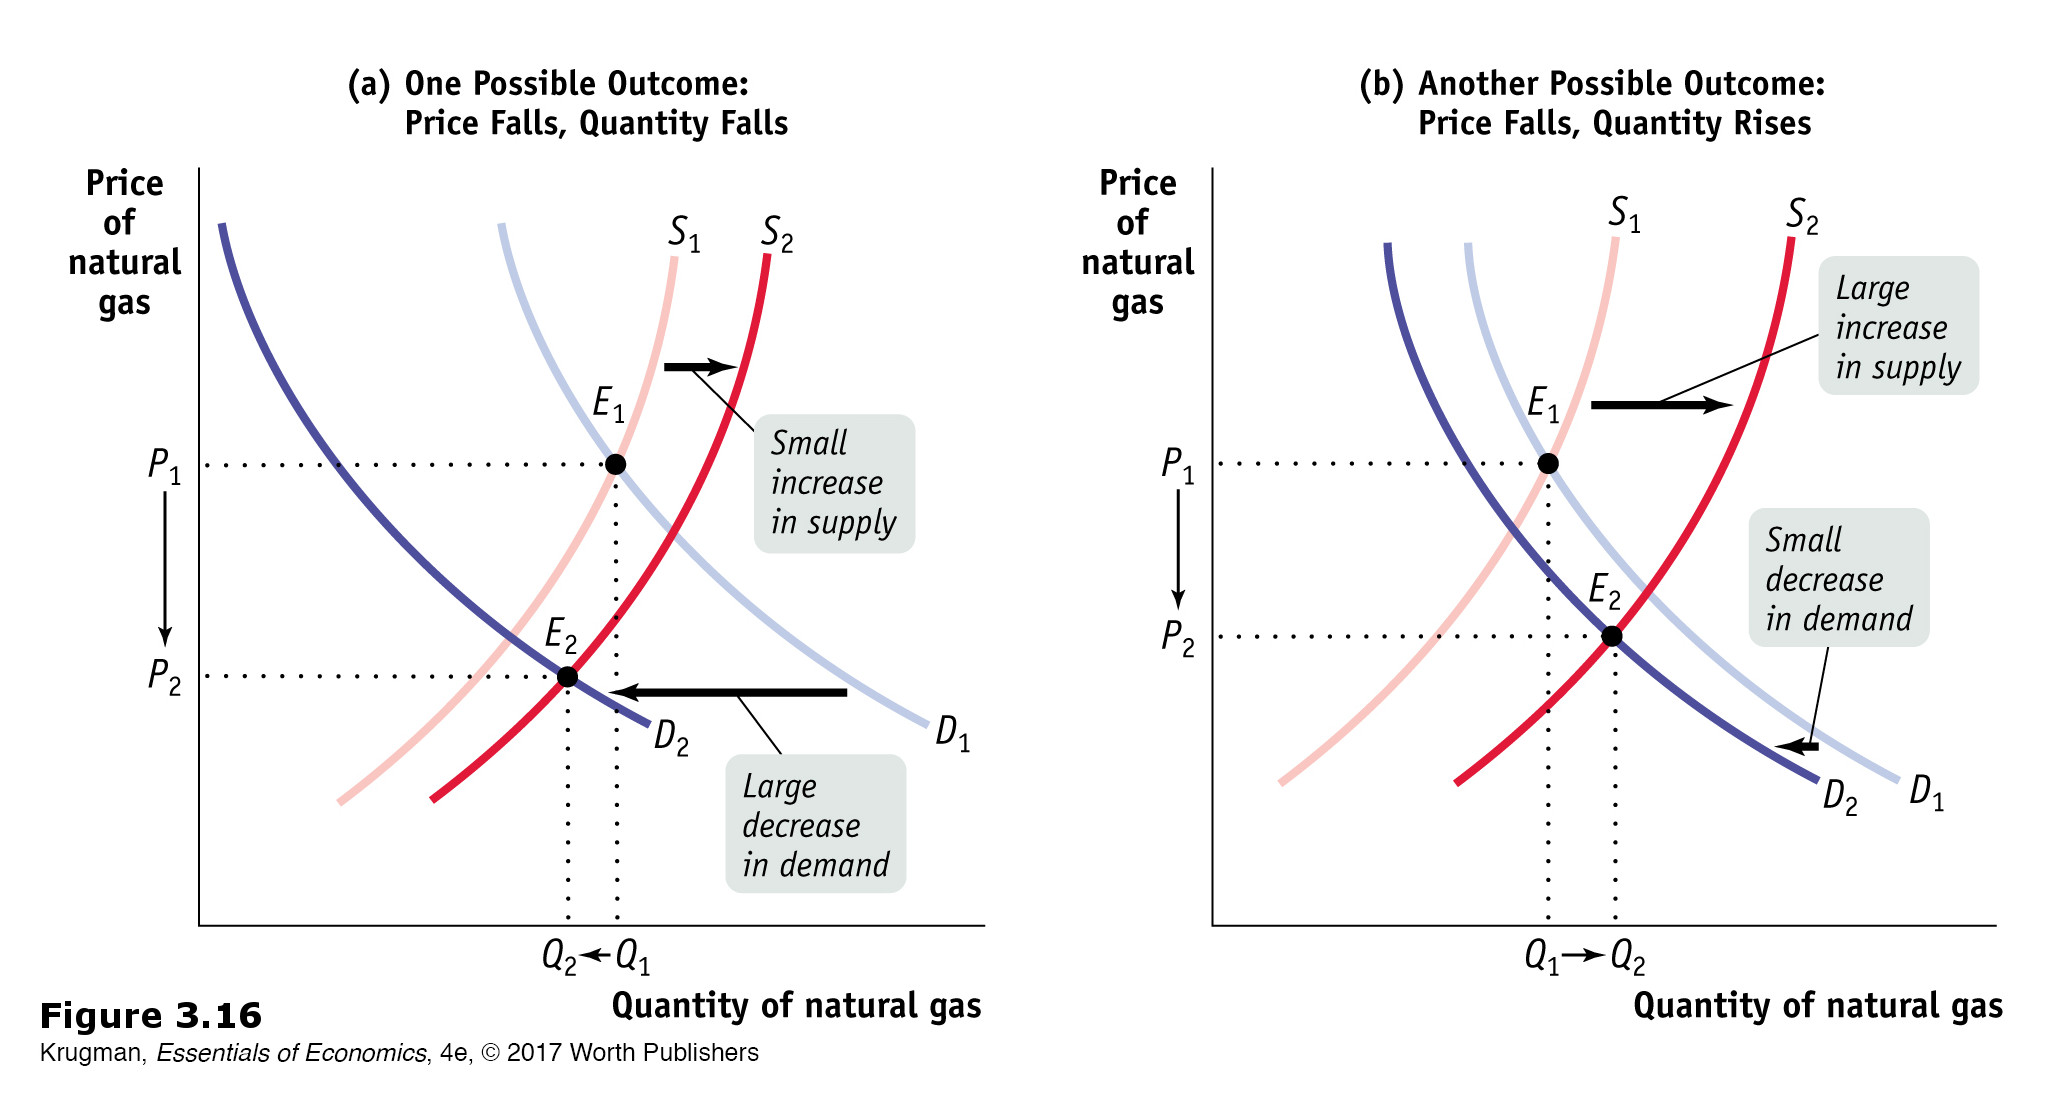
Figure 3.16: In panel (a) there is a simultaneous leftward shift of the demand curve and a rightward shift of the supply curve. Here the decrease in demand is relatively larger than the increase in supply, so the equilibrium quantity falls as the equilibrium price also falls. In panel (b) there is also a simultaneous leftward shift of the demand curve and rightward shift of the supply curve. Here the increase in supply is large relative to the decrease in demand, so the equilibrium quantity rises as the equilibrium price falls.