Figure 3.5: FIGURE 3-5 Individual Demand Curves and the Market Demand Curve
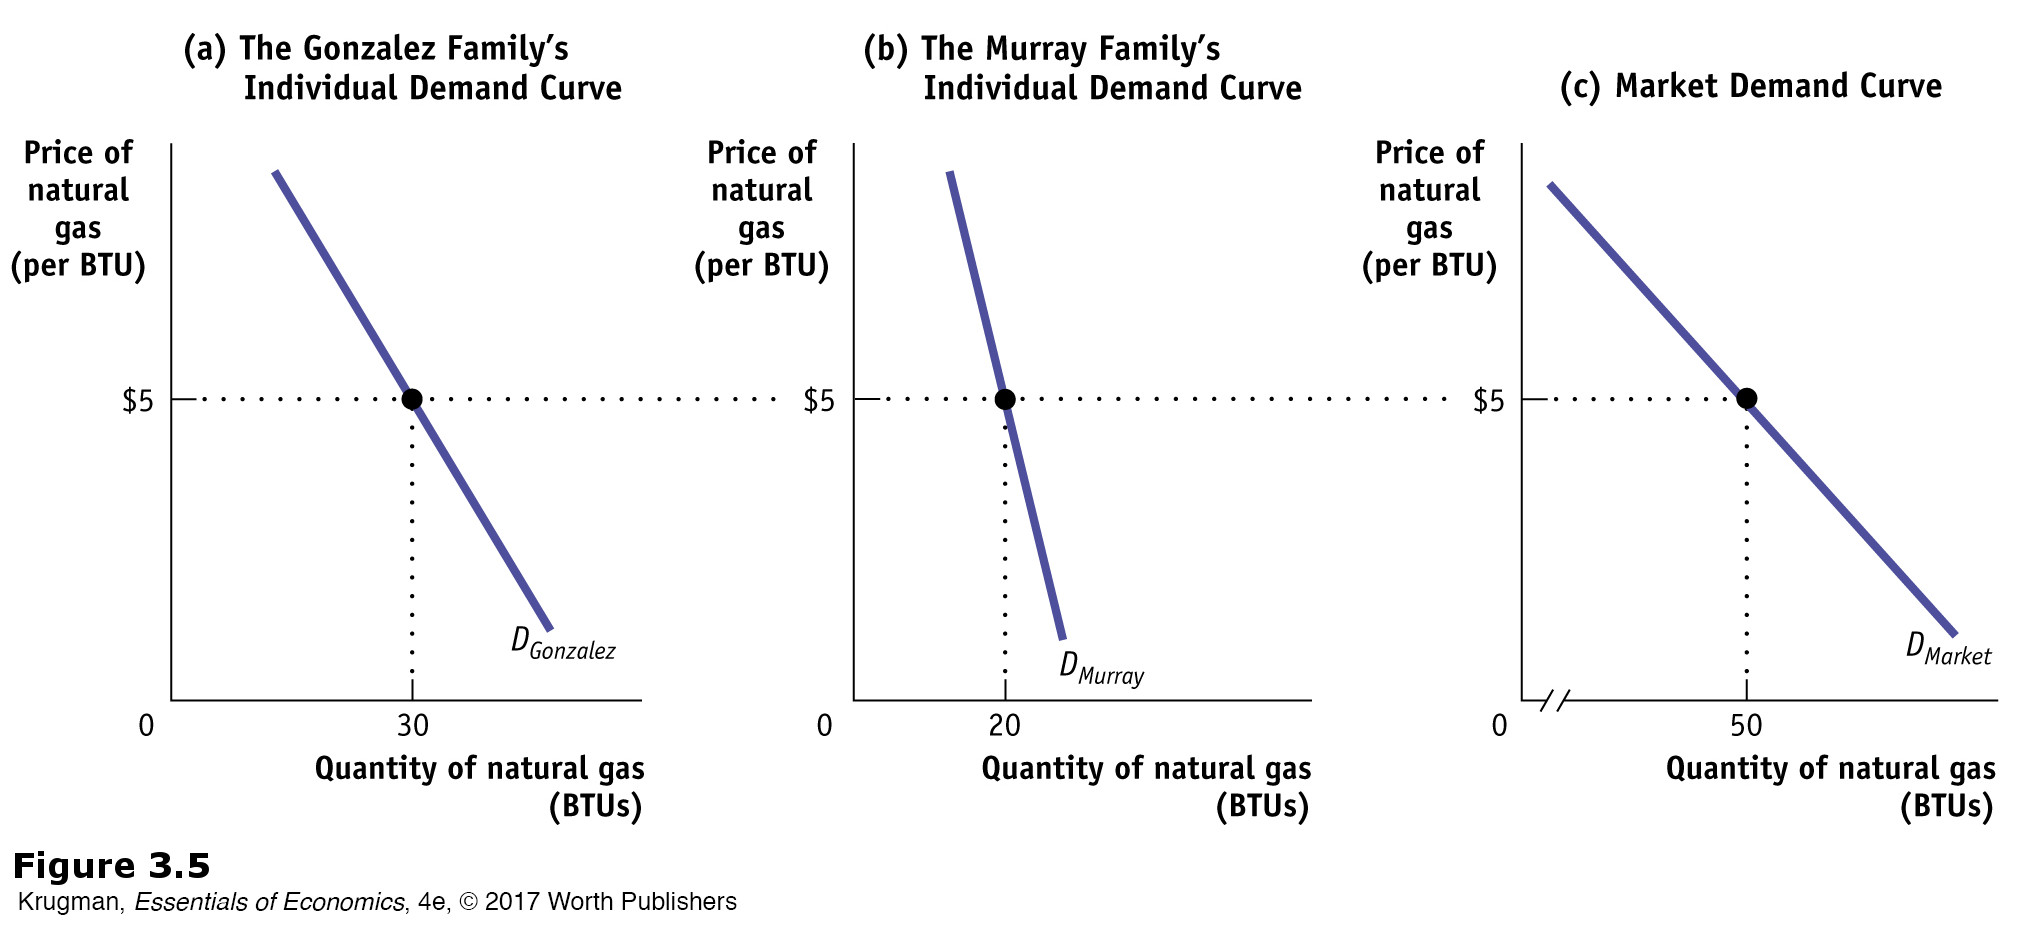
Figure 3.5: The Gonzalez family and the Murray family are the only two consumers of natural gas in the market. Panel (a) shows the Gonzalez family’s individual demand curve: the number of BTUs they will buy per year at any given price. Panel (b) shows the Murray family’s individual demand curve. Given that the Gonzalez family and the Murray family are the only two consumers, the market demand curve, which shows the quantity of BTUs demanded by all consumers at any given price, is shown in panel (c). The market demand curve is the horizontal sum of the individual demand curves of all consumers. In this case, at any given price, the quantity demanded by the market is the sum of the quantities demanded by the Gonzalez family and the Murray family.