FIGURE 4-2Consumer Surplus
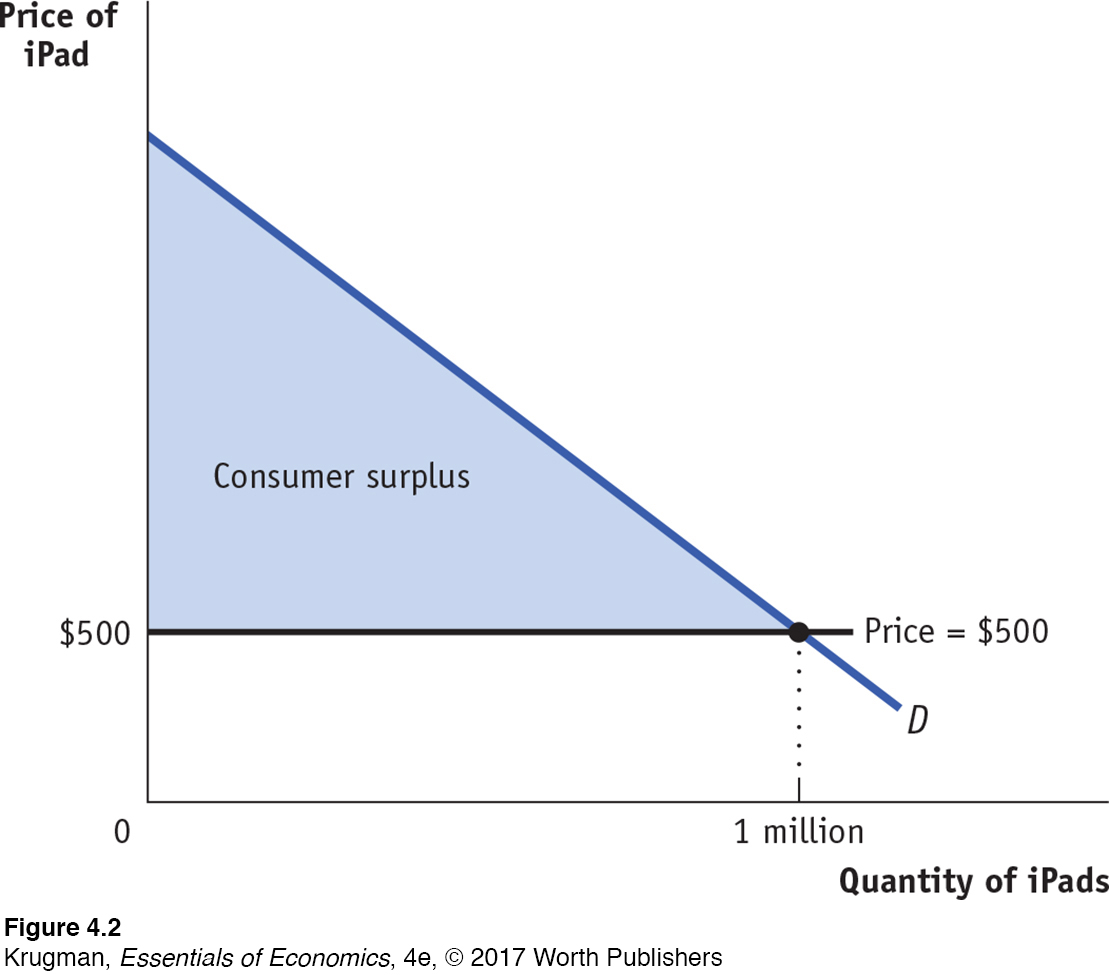 The demand curve for iPads is smooth because there are many potential buyers. At a price of $500, 1 million iPads are demanded. The consumer surplus at this price is equal to the shaded area: the area below the demand curve but above the price. This is the total net gain to consumers generated from buying and consuming iPads when the price is $500.