FIGURE 4-4Producer Surplus
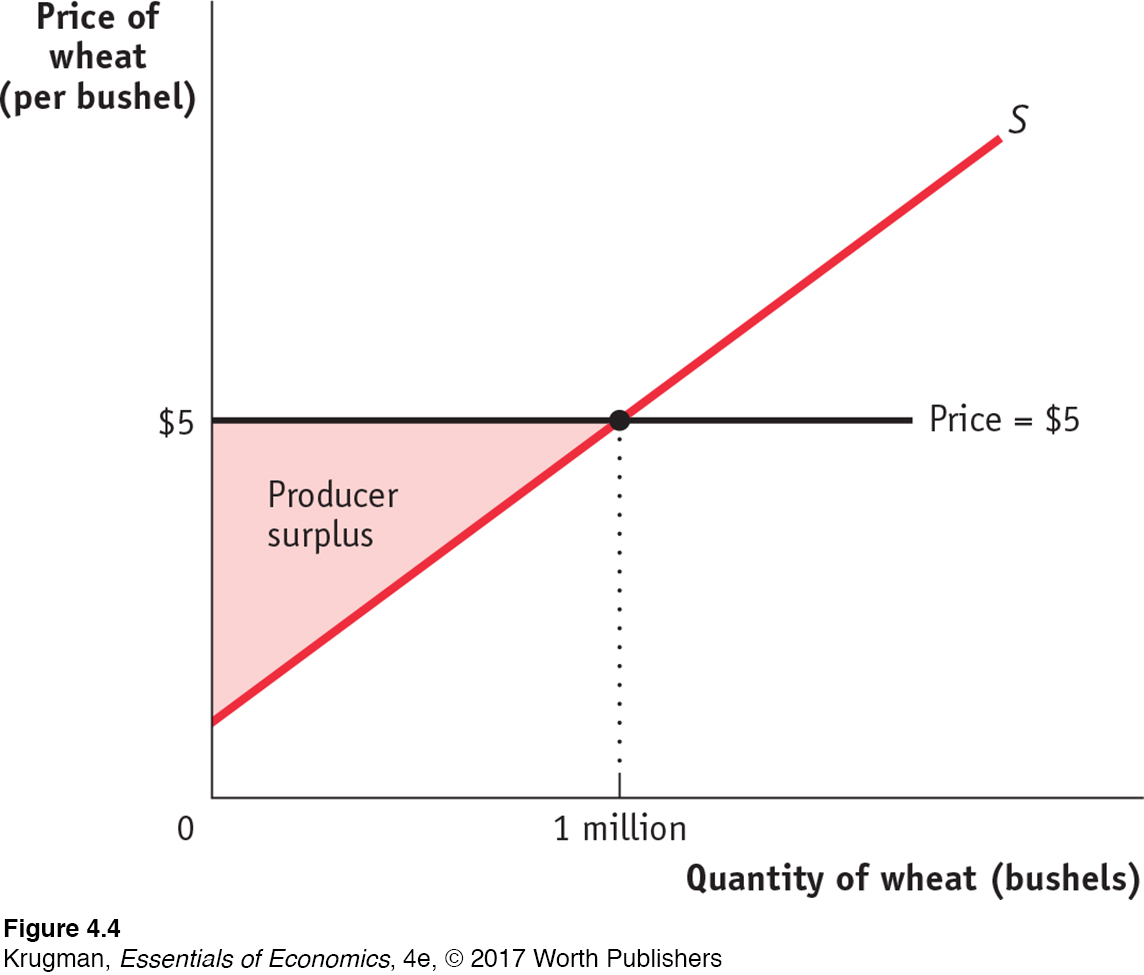 Here is the supply curve for wheat. At a price of $5 per bushel, farmers supply 1 million bushels. The producer surplus at this price is equal to the shaded area: the area above the supply curve but below the price. This is the total gain to producers—farmers in this case—from supplying their product when the price is $5.