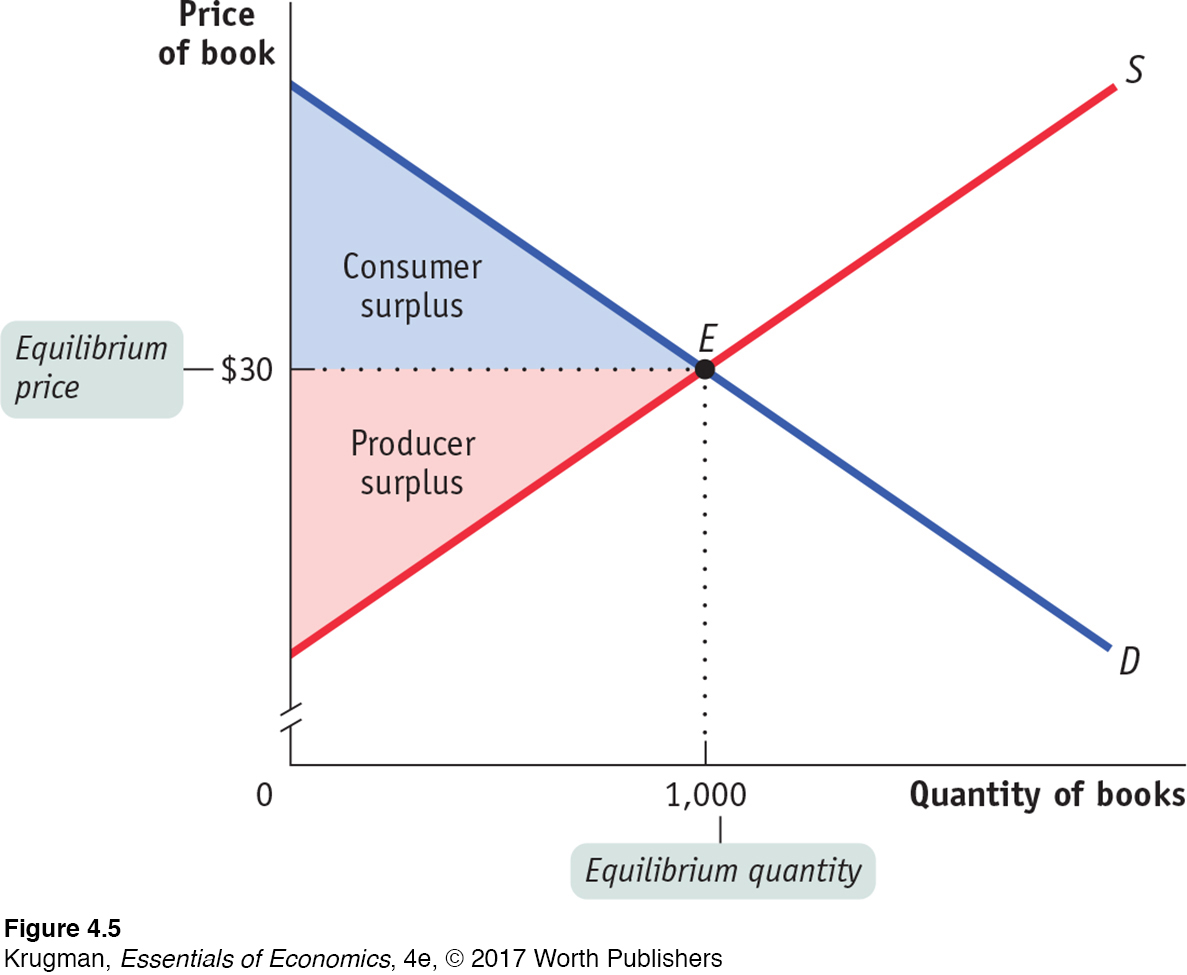
 In the market for used textbooks, the equilibrium price is $30 and the equilibrium quantity is 1,000 books. Consumer surplus is given by the blue area, the area below the demand curve but above the price. Producer surplus is given by the red area, the area above the supply curve but below the price. The sum of the blue and the red areas is total surplus, the total benefit to society from the production and consumption of the good.