Question 4.7
1. Suppose that the supply and demand for taxi rides is given by Figure 4-13 but the quota is set at 6 million rides instead of 8 million. Find the following and indicate them on Figure 4-13.
The price of a ride
The price of a ride is $7 since the quantity demanded at this price is 6 million: $7 is the demand price of 6 million rides. This is represented by point A in the accompanying figure.
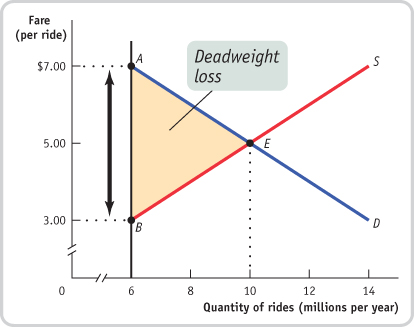
The quota rent
At 6 million rides, the supply price is $3 per ride, represented by point B in the figure. The wedge between the demand price of $7 per ride and the supply price of $3 per ride is the quota rent per ride, $4. This is represented in the figure above by the vertical distance between points A and B.
The deadweight loss
The quota discourages 4 million mutually beneficial transactions. The shaded triangle in the figure represents the deadweight loss.
Suppose the quota limit on taxi rides is increased to 9 million. What happens to the quota rent? To the deadweight loss?
At 9 million rides, the demand price is $5.50 per ride, indicated by point C in the accompanying figure, and the supply price is $4.50 per ride, indicated by point D. The quota rent is the difference between the demand price and the supply price: $1. The deadweight loss is represented by the shaded triangle in the figure. As you can see, the deadweight loss is smaller when the quota is set at 9 million rides than when it is set at 6 million rides.