Figure 5.4: FIGURE 5-4 Total Revenue
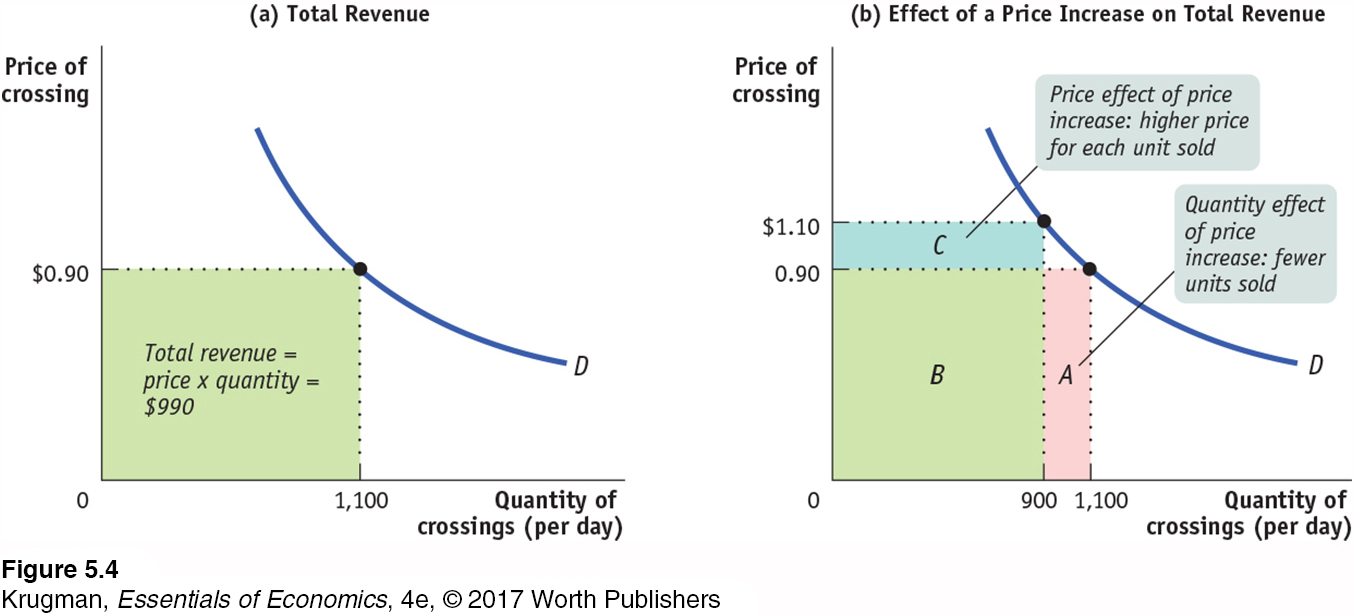
Figure 5.4: The green rectangle in panel (a) shows the total revenue generated from 1,100 drivers who each pay a toll of $0.90. Panel (b) shows how total revenue is affected when the price increases from $0.90 to $1.10. Due to the quantity effect, total revenue falls by area A. Due to the price effect, total revenue increases by the area C. In general, the overall effect can go either way, depending on the price elasticity of demand.