Figure 5.5: FIGURE 5-5 The Price Elasticity of Demand Changes Along the Demand Curve
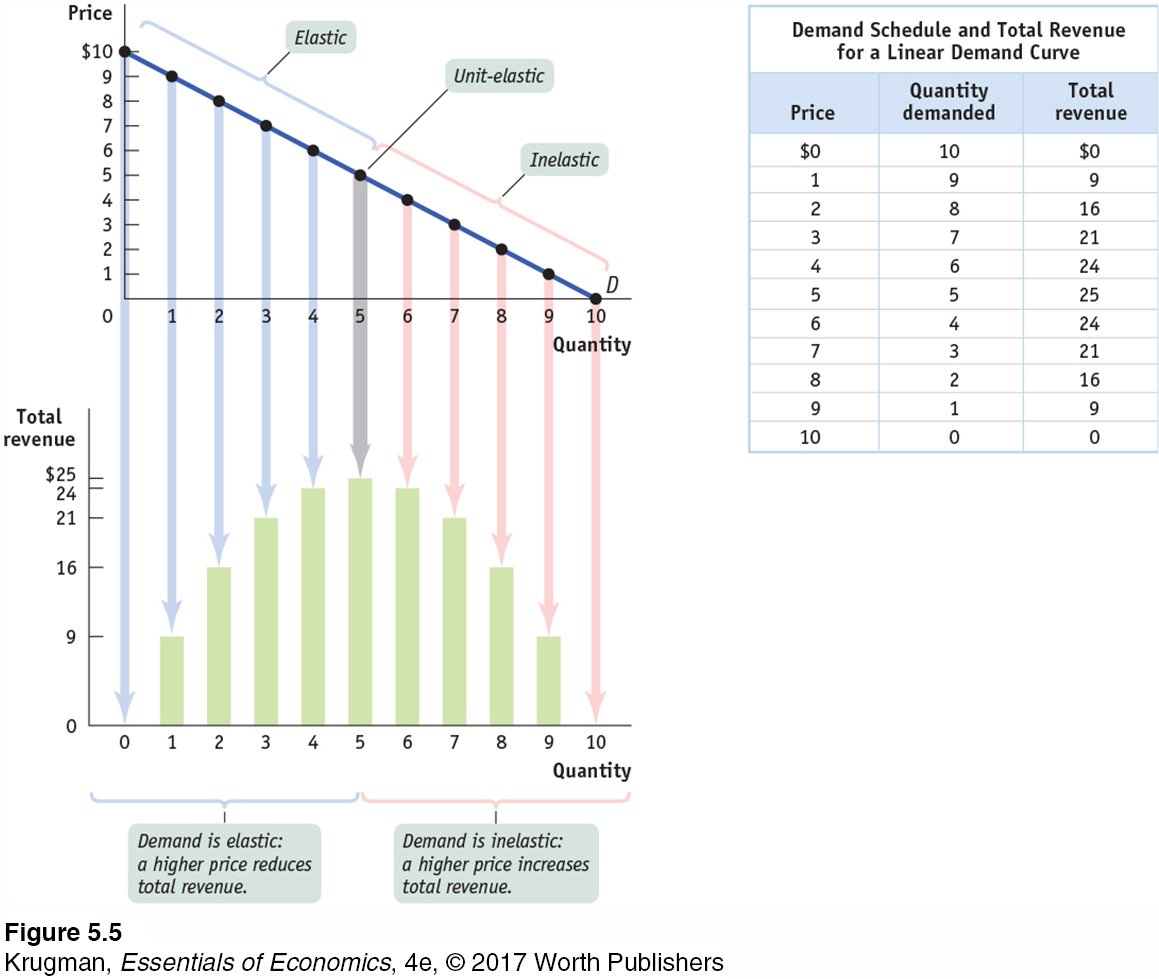
Figure 5.5: The upper panel shows a demand curve corresponding to the demand schedule in the table. The lower panel shows how total revenue changes along that demand curve: at each price and quantity combination, the height of the bar represents the total revenue generated. You can see that at a low price, raising the price increases total revenue. So demand is inelastic at low prices. At a high price, however, a rise in price reduces total revenue. So demand is elastic at high prices.