Figure 5.9: FIGURE 5-9 A Tax Reduces Consumer and Producer Surplus
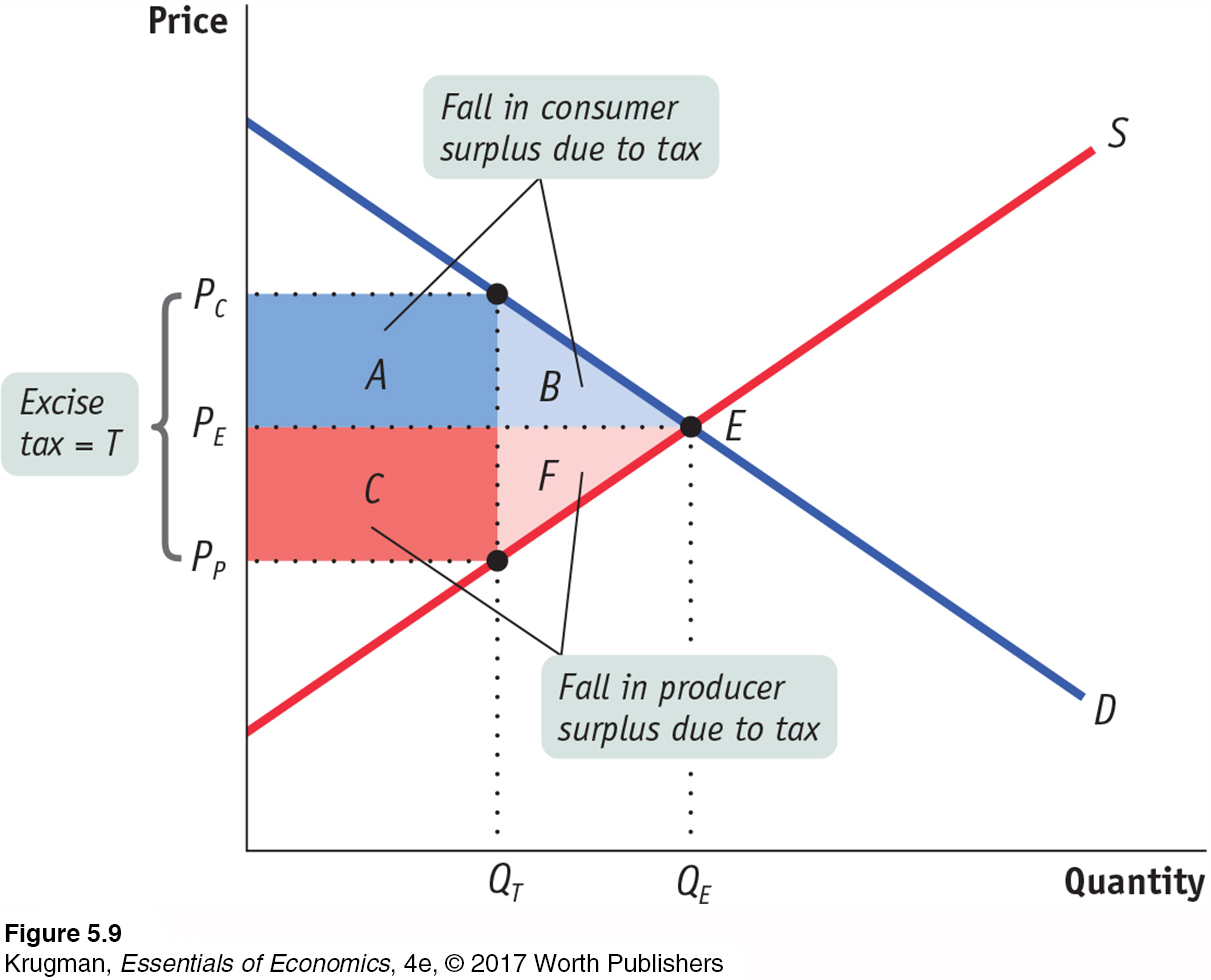
Figure 5.9: Before the tax, the equilibrium price and quantity are PE and QE, respectively. After an excise tax of T per unit is imposed, the price to consumers rises to PC and consumer surplus falls by the sum of the dark blue rectangle, labeled A, and the light blue triangle, labeled B. The tax also causes the price to producers to fall to PP; producer surplus falls by the sum of the red rectangle, labeled C, and the pink triangle, labeled F. The government receives revenue from the tax equal to Q(T) × T, which is given by the sum of the areas A and C. Areas B and F represent the losses to consumer and producer surplus that are not collected by the government as revenue. They are the deadweight loss to society of the tax.