FIGURE 6- 1 Production Function and Total Product Curve for George and Martha’s Farm
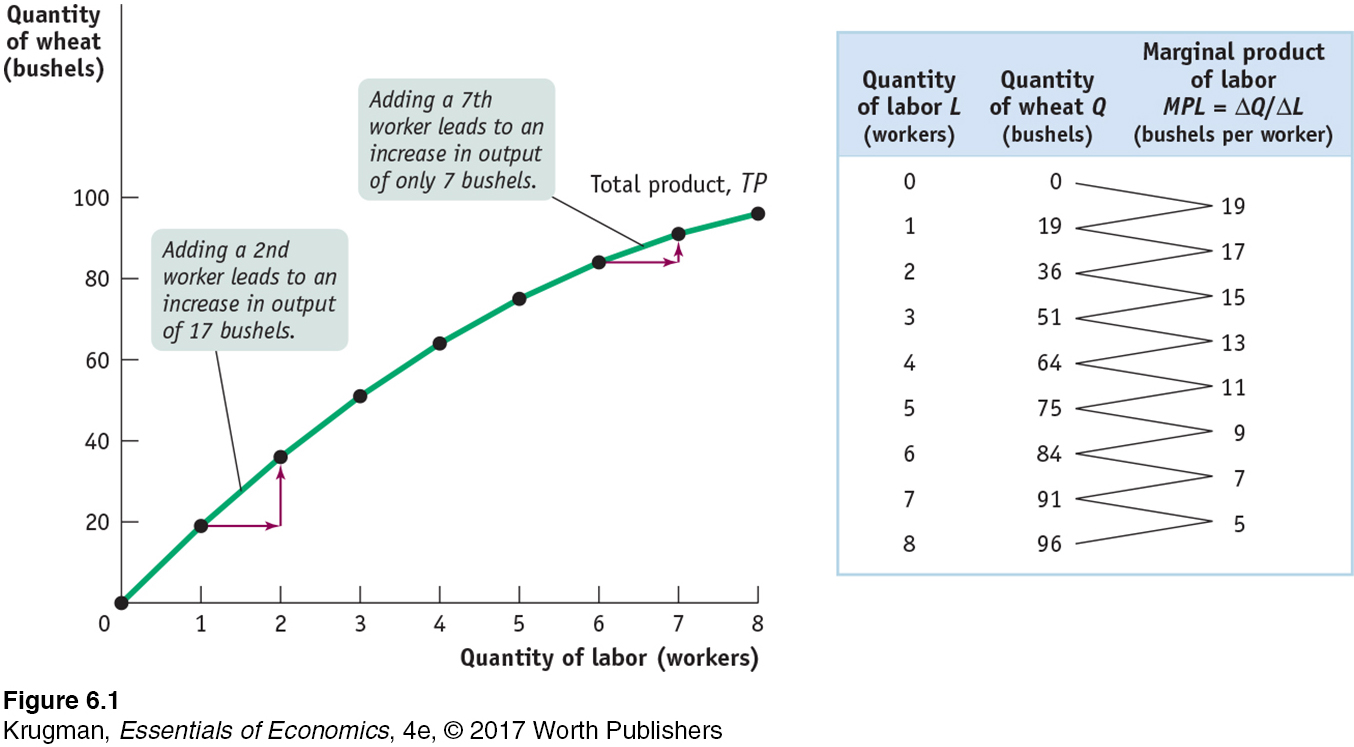 The table shows the production function, the relationship between the quantity of the variable input (labor, measured in number of workers) and the quantity of output (wheat, measured in bushels) for a given quantity of the fixed input. It also calculates the marginal product of labor on George and Martha’s farm. The total product curve shows the production function graphically. It slopes upward because more wheat is produced as more workers are employed. It also becomes flatter because the marginal product of labor declines as more and more workers are employed.