FIGURE 6- 2 Marginal Product of Labor Curve for George and Martha’s Farm
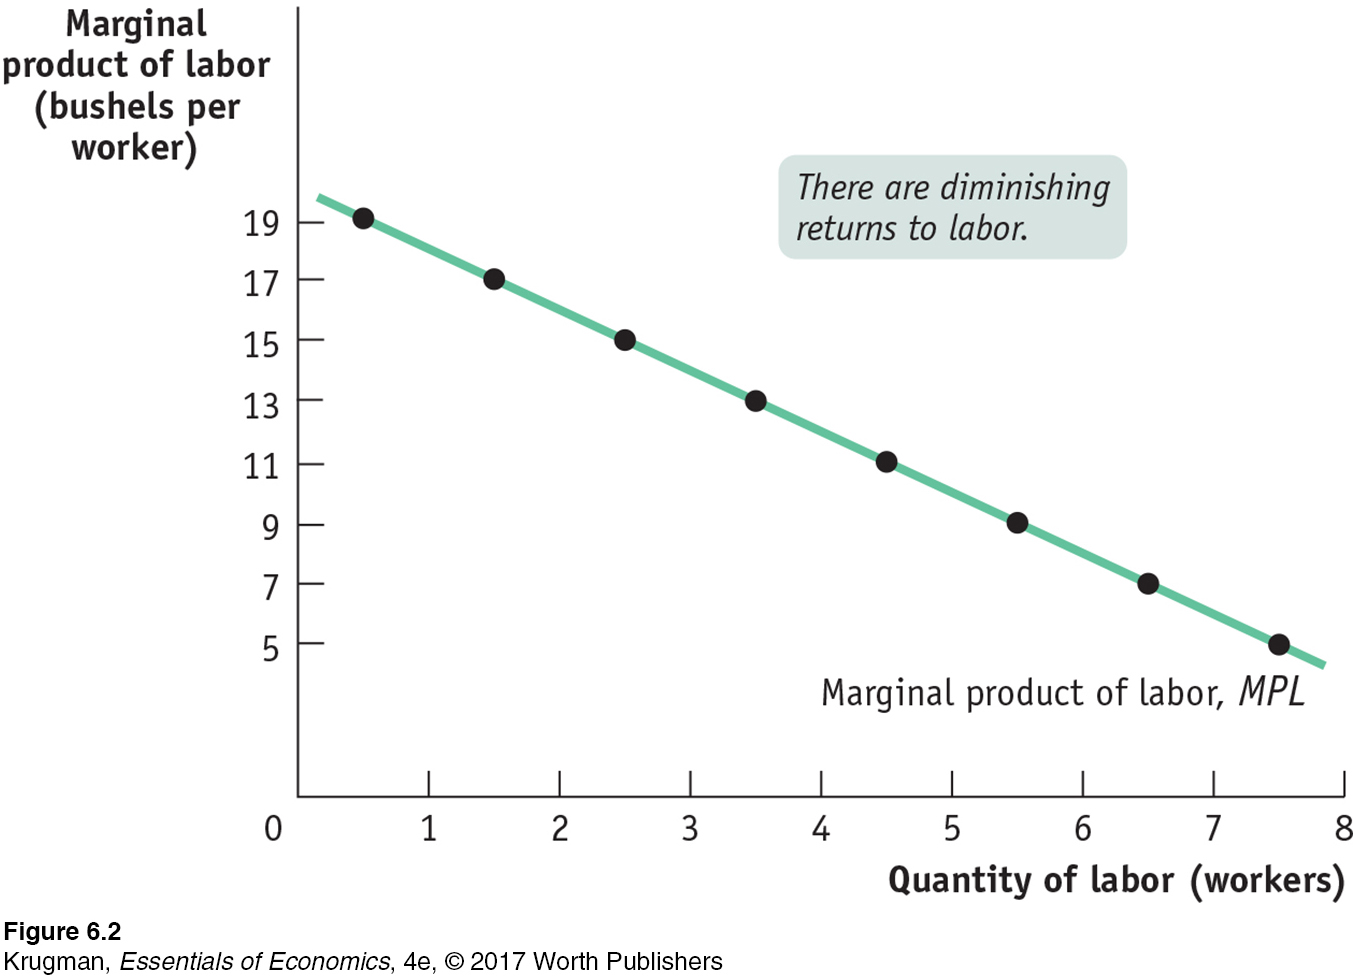 The marginal product of labor curve plots each worker’s marginal product, the increase in the quantity of output generated by each additional worker. The change in the quantity of output is measured on the vertical axis and the number of workers employed is on the horizontal axis. The first worker employed generates an increase in output of 19 bushels, the second worker generates an increase of 17 bushels, and so on. The curve slopes downward due to diminishing returns to labor.