FIGURE 6- 3 Total Product, Marginal Product, and the Fixed Input
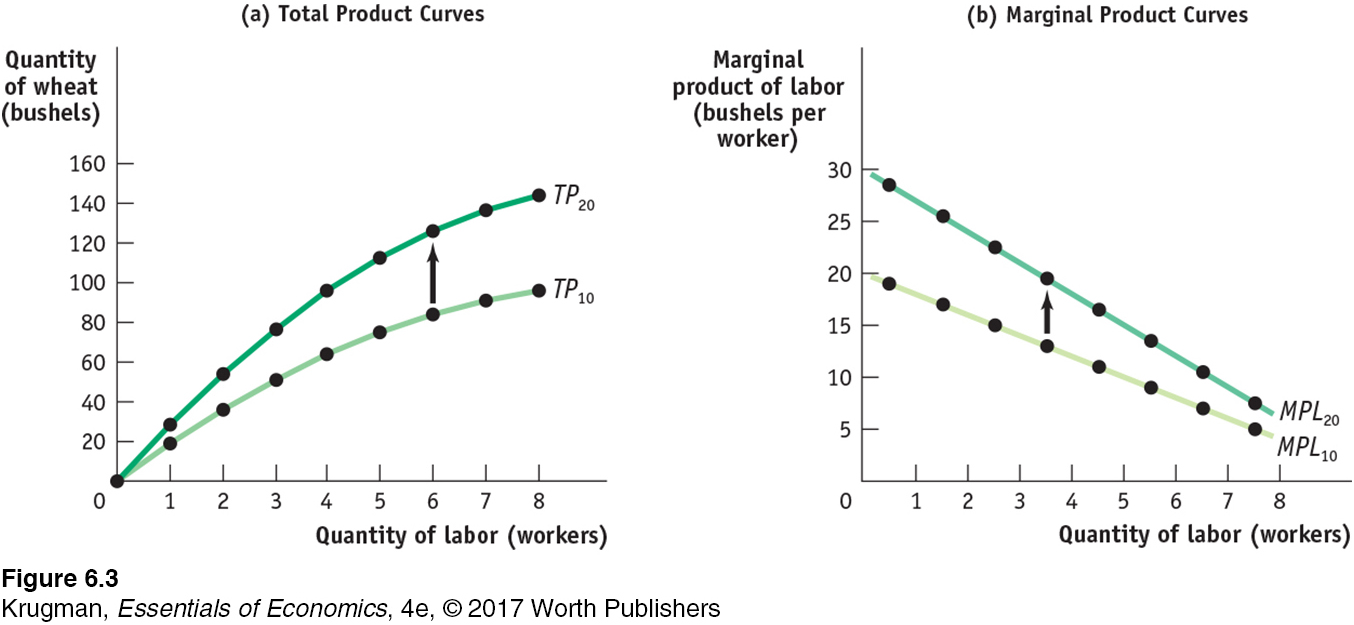 This figure shows how the quantity of output and the marginal product of labor depend on the level of the fixed input. Panel (a) shows two total product curves for George and Martha’s farm, TP10 when their farm is 10 acres and TP20 when it is 20 acres. With more land, each worker can produce more wheat. So an increase in the fixed input shifts the total product curve up from TP10 to TP20. This implies that the marginal product of each worker is higher when the farm is 20 acres than when it is 10 acres. Panel (b) shows the marginal product of labor curves. The increase in acreage also shifts the marginal product of labor curve up from MPL10 to MPL20. Note that both marginal product of labor curves still slope downward due to diminishing returns to labor.