FIGURE 6-4 Total Cost Curve for George and Martha’s Farm
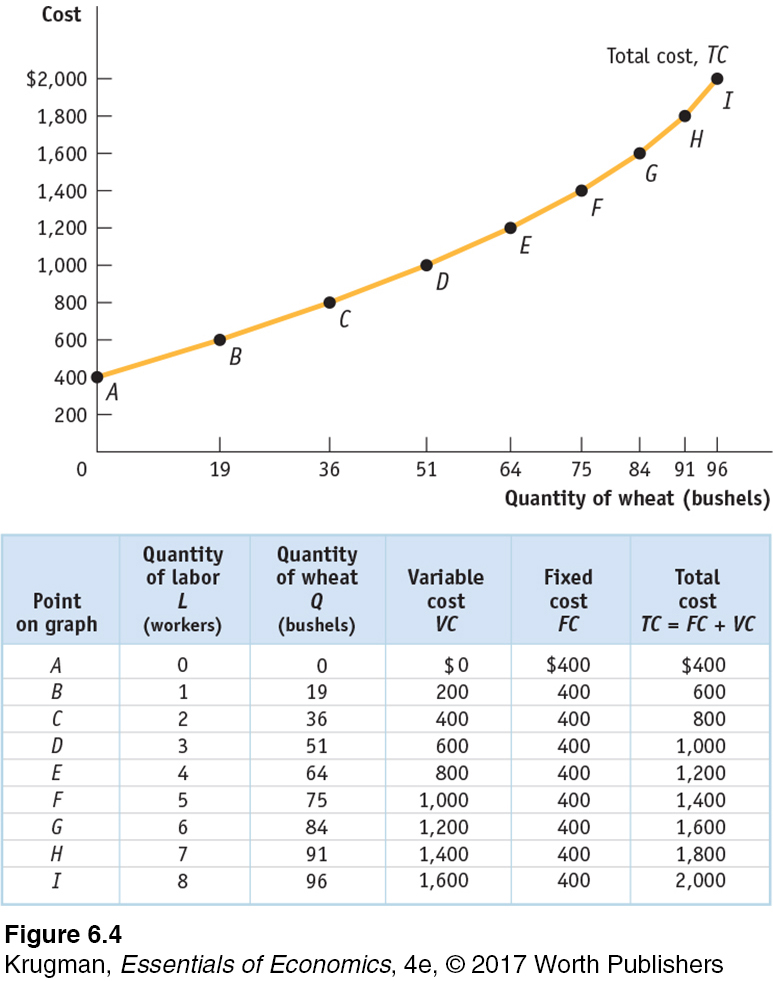
The table shows the variable cost, fixed cost, and total cost for various output quantities on George and Martha’s 1
0-acre farm. The total cost curve shows how total cost (measured on the vertical axis) depends on the quantity of output (measured on the horizontal axis). The labeled points on the curve correspond to the rows of the table. The total cost curve slopes upward because the number of workers employed, and hence total cost, increases as the quantity of output increases. The curve gets steeper as output increases due to diminishing returns to labor.