FIGURE 6-6 Total Cost and Marginal Cost Curves for Selena’s Gourmet Salsas
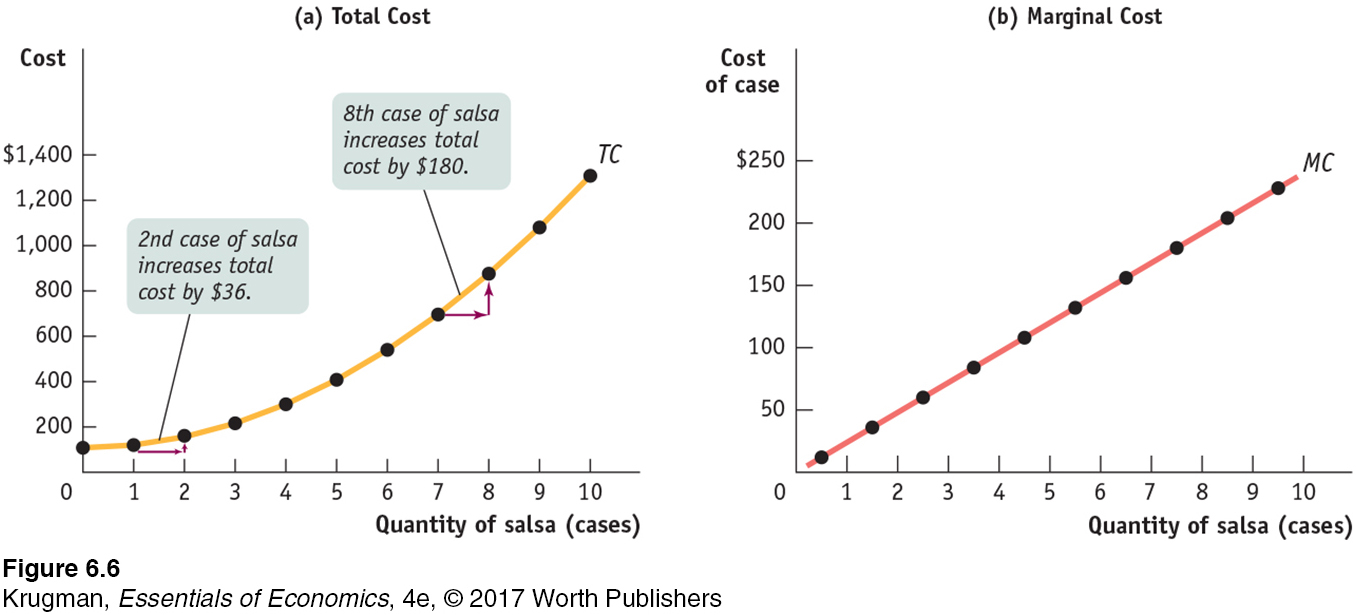 Panel (a) shows the total cost curve from Table 6-1. Like the total cost curve in Figure 6-4, it slopes upward and gets steeper as we move up it to the right. Panel (b) shows the marginal cost curve. It also slopes upward, reflecting diminishing returns to the variable input.