Question 6.5
3. Draw a graph like Figure 6-12 and insert a short-run average total cost curve corresponding to a long-run output choice of 5 cases of salsa per day. Use the graph to show why Selena should change her fixed cost if she expects to produce only 4 cases per day for a long period of time.
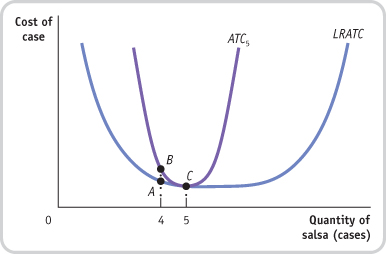
The accompanying diagram shows the long-run average total cost curve (LRATC) and the short-run average total cost curve corresponding to a long-run output choice of 5 cases of salsa (ATC5). The curve ATC5 shows the short-run average total cost for which the level of fixed cost minimizes average total cost at an output of 5 cases of salsa. This is confirmed by the fact that at 5 cases per day, ATC5 touches LRATC, the long-run average total cost curve.
If Selena expects to produce only 4 cases of salsa for a long time, she should change her fixed cost. If she does not change her fixed cost and produces 4 cases of salsa, her average total cost in the short run is indicated by point B on ATC5; it is no longer on the LRATC. If she changes her fixed cost, though, her average total cost could be lower, at point A.