FIGURE 7-3 Profitability and the Market Price
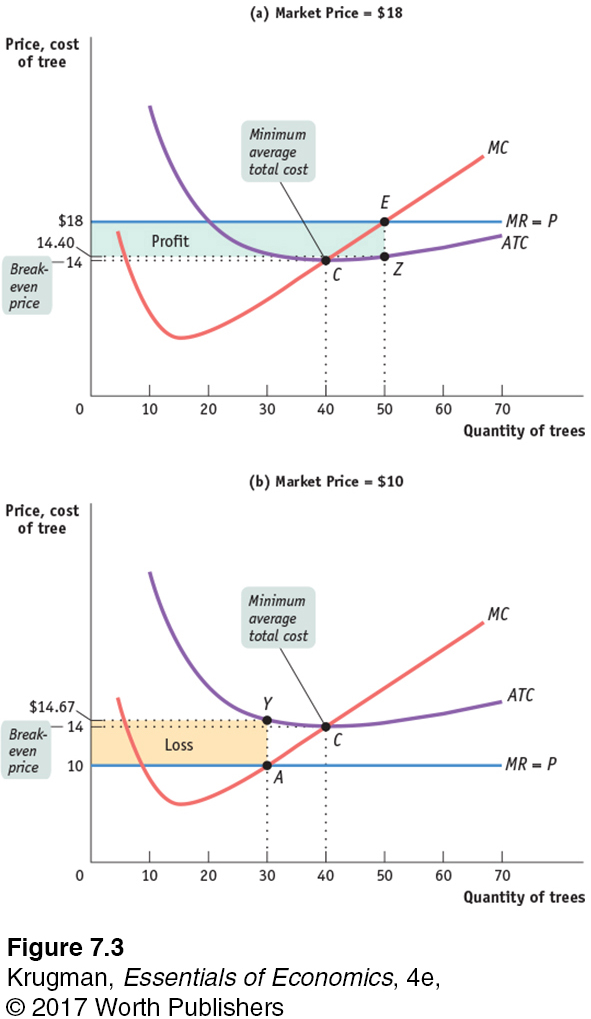 In panel (a) the market price is $18.00. The farm is profitable because price exceeds minimum average total cost, the break-even price, $14.00. The farm’s optimal output choice is indicated by point E, corresponding to an output of 50 trees. The average total cost of producing 50 trees is indicated by point Z on the ATC curve, corresponding to an amount of $14.40. The vertical distance between E and Z corresponds to the farm’s per-unit profit, $18.00 − $14.40 = $3.60. Total profit is given by the area of the shaded rectangle, 50 × $3.60 = $180.00. In panel (b) the market price is $10; the farm is unprofitable because the price falls below the minimum average total cost, $14.00. The farm’s optimal output choice when producing is indicated by point A, corresponding to an output of 30 trees. The farm’s per-unit loss, $14.67 − $10.00 = $4.67, is represented by the vertical distance between A and Y. The farm’s total loss is represented by the shaded rectangle, 30 × $4.67 = $140.00 (adjusted for rounding error).