FIGURE 7-6 The Long-Run Market Equilibrium
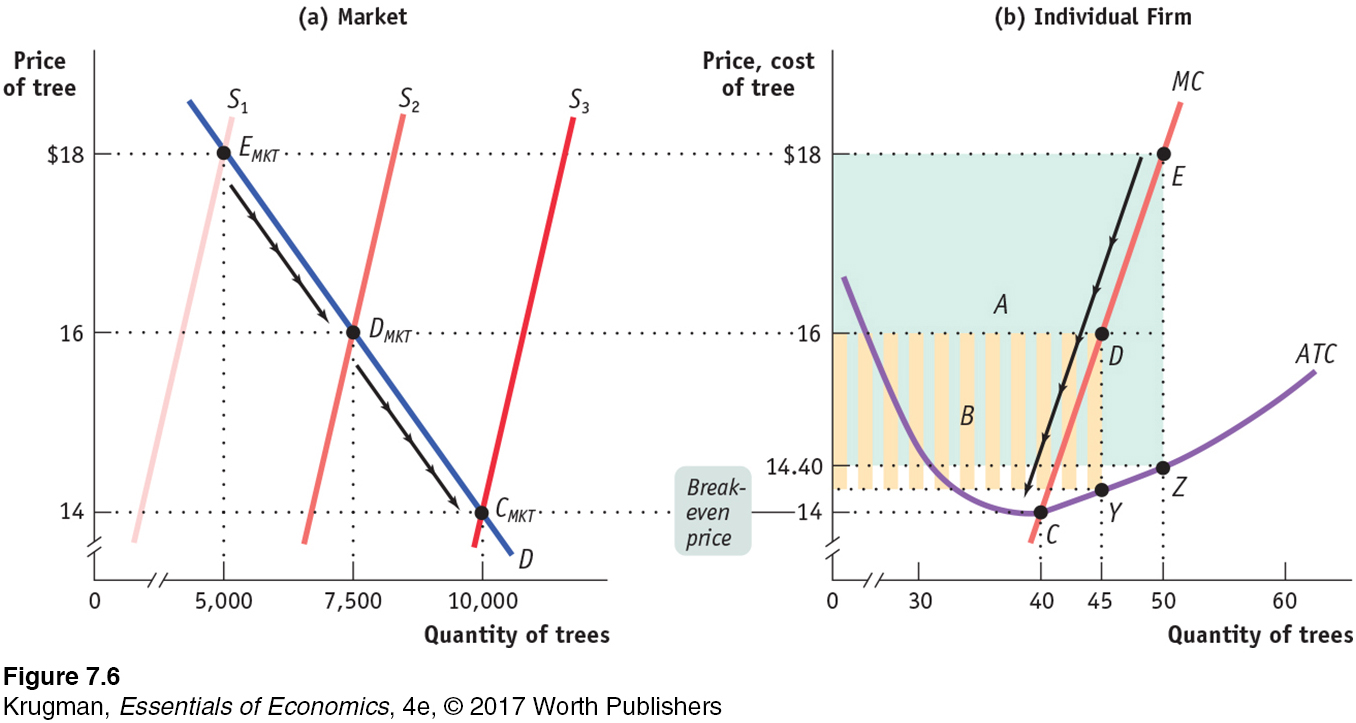 Point EMKT of panel (a) shows the initial short-run market equilibrium. Each of the 100 existing producers makes an economic profit, illustrated in panel (b) by the green rectangle labeled A, the profit of an existing firm. Profits induce entry by additional producers, shifting the short-run industry supply curve outward from S1 to S2 in panel (a), resulting in a new short-run equilibrium at point DMKT, at a lower market price of $16 and higher industry output. Existing firms reduce output and profit falls to the area given by the striped rectangle labeled B in panel (b). Entry continues to shift out the short-run industry supply curve, as price falls and industry output increases yet again. Entry of new firms ceases at point CMKT on supply curve S3 in panel (a). Here market price is equal to the break-even price; existing producers make zero economic profits, and there is no incentive for entry or exit. So CMKT is also a long-run market equilibrium.