FIGURE 7-7 The Effect of an Increase in Demand in the Short Run and the Long Run
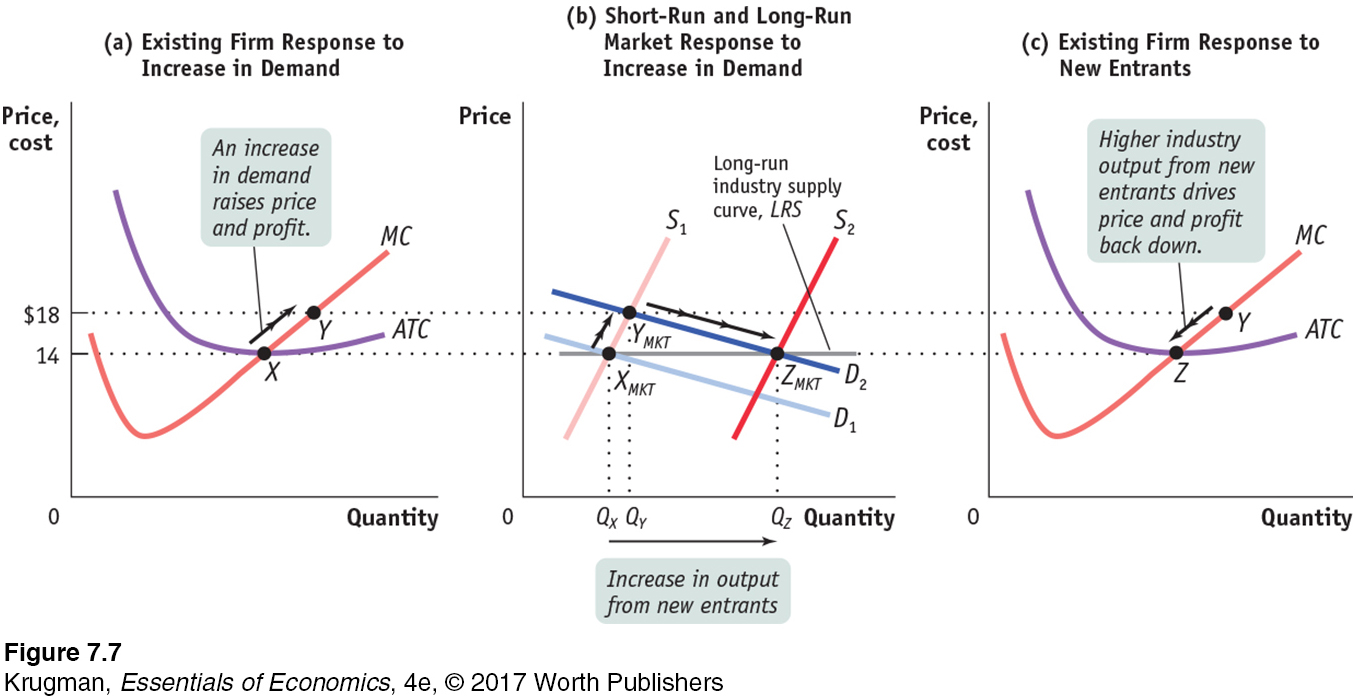 Panel (b) shows how an industry adjusts in the short and long run to an increase in demand; panels (a) and (c) show the corresponding adjustments by an existing firm. Initially the market is at point XMKT in panel (b), a short-run and long-run equilibrium at a price of $14 and industry output of QX. An existing firm makes zero economic profit, operating at point X in panel (a) at minimum average total cost. Demand increases as D1 shifts rightward to D2 in panel (b), raising the market price to $18. Existing firms increase their output, and industry output moves along the short-run industry supply curve S1 to a short-run equilibrium at YMKT. Correspondingly, the existing firm in panel (a) moves from point X to point Y. But at a price of $18 existing firms are profitable. As shown in panel (b), in the long run new entrants arrive and the short-run industry supply curve shifts rightward, from S1 to S2. There is a new equilibrium at point ZMKT, at a lower price of $14 and higher industry output of QZ. An existing firm responds by moving from Y to Z in panel (c), returning to its initial output level and zero economic profit. Production by new entrants accounts for the total increase in industry output, QZ − QX. Like XMKT, ZMKT is also a short-run and long-run equilibrium: with existing firms earning zero economic profit, there is no incentive for any firms to enter or exit the industry. The horizontal line passing through XMKT and ZMKT, LRS, is the long-run industry supply curve: at the break-even price of $14, producers will produce any amount that consumers demand in the long run.