FIGURE 8-7 The Monopolist’s Profit
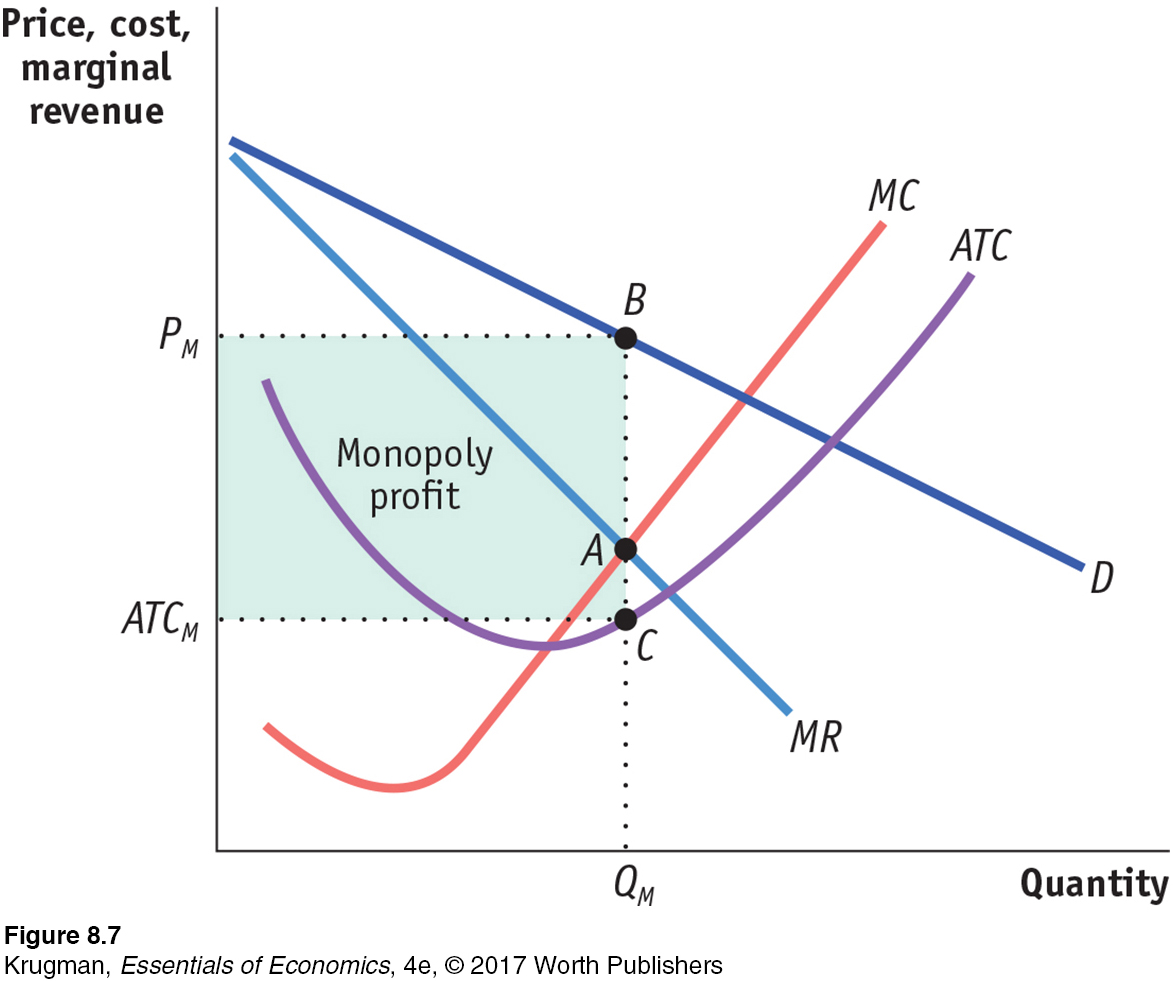 In this case, the marginal cost curve has a “swoosh” shape and the average total cost curve is U-shaped. The monopolist maximizes profit by producing the level of output at which MR = MC, given by point A, generating quantity QM. It finds its monopoly price, PM, from the point on the demand curve directly above point A, point B here. The average total cost of QM is shown by point C. Profit is given by the area of the shaded rectangle.