Question 8.5
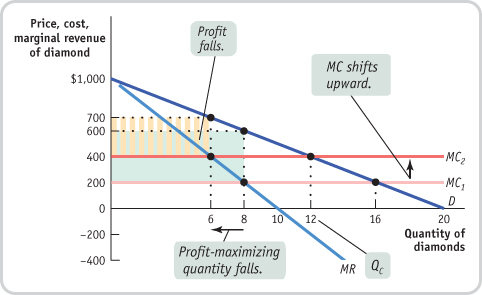
2. Use Figure 8-6 to show what happens to the following when the marginal cost of diamond production rises from $200 to $400.
Marginal cost curve
Profit-maximizing price and quantity
Profit of the monopolist
Perfectly competitive industry profits
As the accompanying diagram shows, the marginal cost curve shifts upward to $400. The profit-maximizing price rises and quantity falls. Profit falls from $3,200 to $300 × 6 = $1,800. Competitive industry profits, though, are unchanged at zero.