12.2 The Business Cycle
The Great Depression was by far the worst economic crisis in U.S. history. But although the economy managed to avoid catastrophe for the rest of the twentieth century, it has experienced many ups and downs.
It’s true that the ups have consistently been bigger than the downs: a chart of any of the major numbers used to track the U.S. economy shows a strong upward trend over time. For example, Figure 12-2 shows total U.S. private-
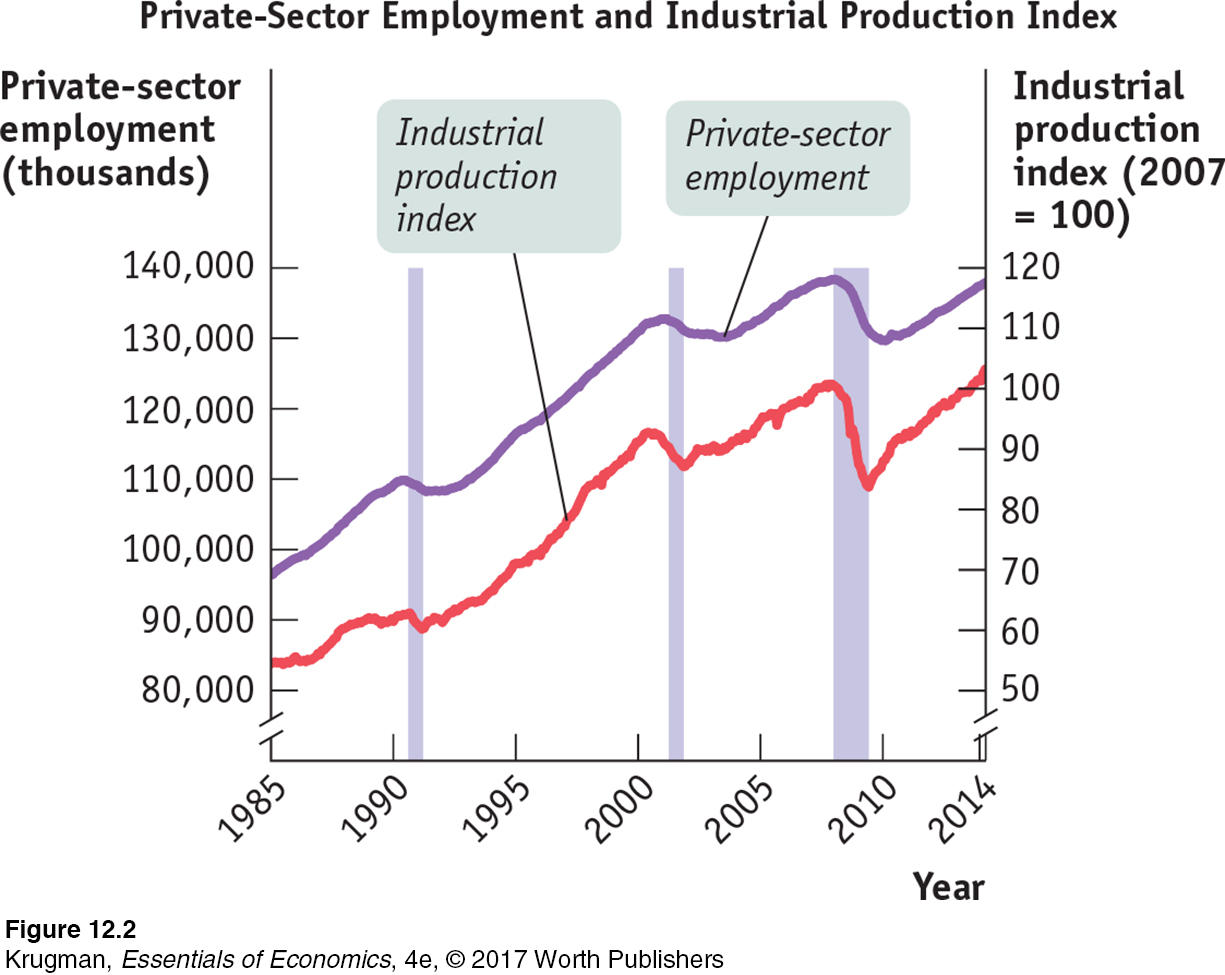
But they didn’t rise steadily. As you can see from the figure, there were three periods—
The economy’s forward march, in other words, isn’t smooth. And the uneven pace of the economy’s progress, its ups and downs, is one of the main preoccupations of macroeconomics.
Charting the Business Cycle
Figure 12-3 shows a stylized representation of the way the economy evolves over time. The vertical axis shows either employment or an indicator of how much the economy is producing, such as industrial production or real gross domestic product (real GDP), a measure of the economy’s overall output that we’ll learn about in the next chapter. As the data in Figure 12-2 suggest, these two measures tend to move together. Their common movement is the starting point for a major theme of macroeconomics: the economy’s alternation between short-
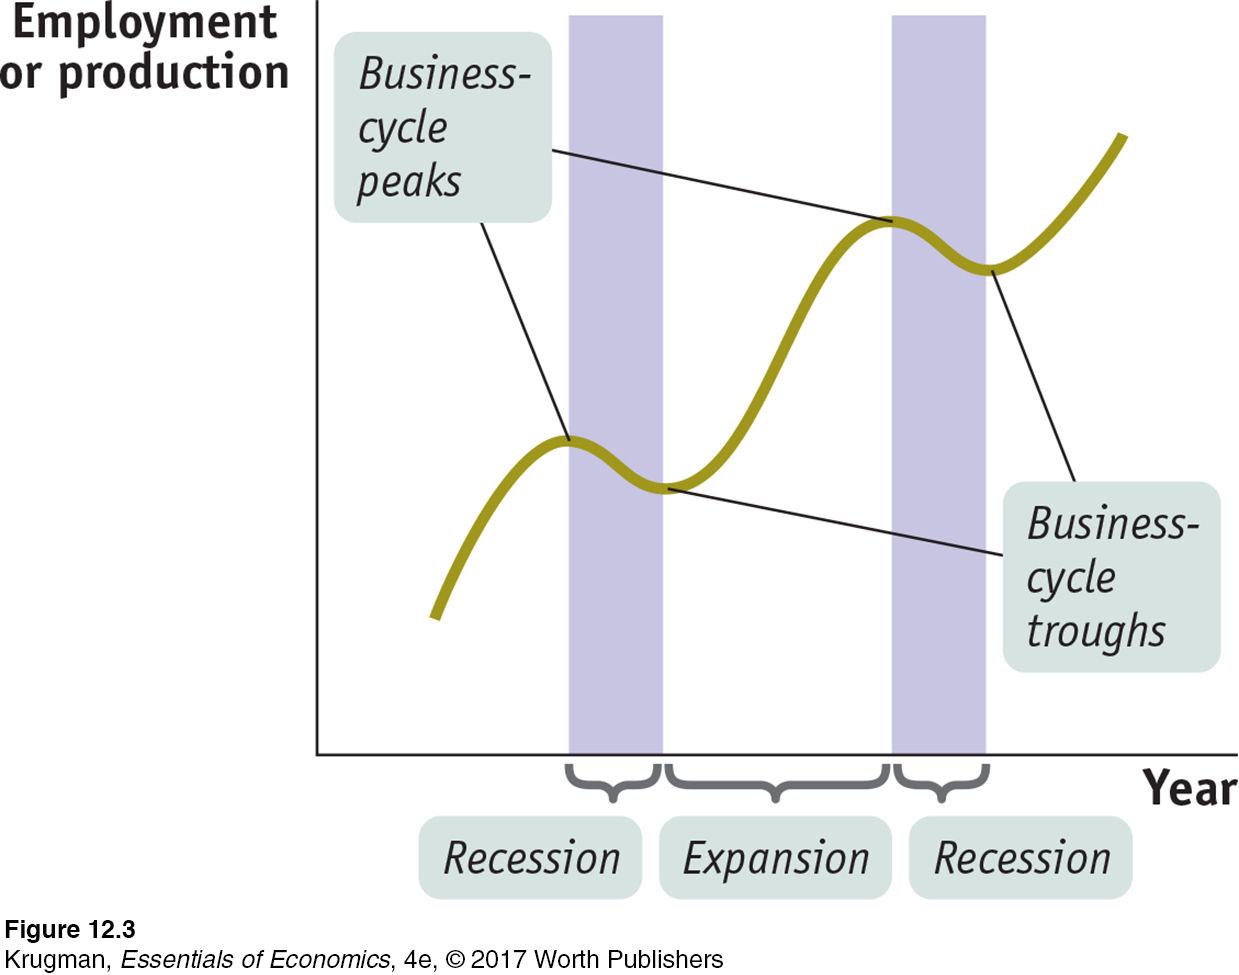
Recessions, or contractions, are periods of economic downturn when output and employment are falling.
Expansions, or recoveries, are periods of economic upturn when output and employment are rising.
A broad-
The business cycle is the short-
The point at which the economy turns from expansion to recession is a business-
The point at which the economy turns from recession to expansion is a business-
The alternation between recessions and expansions is known as the business cycle. The point in time at which the economy shifts from expansion to recession is known as a business-
The business cycle is an enduring feature of the economy. Table 12-2 shows the official list of business-
| Business- |
Business- |
| no prior data available | December 1854 |
| June 1857 | December 1858 |
| October 1860 | June 1861 |
| April 1865 | December 1867 |
| June 1869 | December 1870 |
| October 1873 | March 1879 |
| March 1882 | May 1885 |
| March 1887 | April 1888 |
| July 1890 | May 1891 |
| January 1893 | June 1894 |
| December 1895 | June 1897 |
| June 1899 | December 1900 |
| September 1902 | August 1904 |
| May 1907 | June 1908 |
| January 1910 | January 1912 |
| January 1913 | December 1914 |
| August 1918 | March 1919 |
| January 1920 | July 1921 |
| May 1923 | July 1924 |
| October 1926 | November 1927 |
| August 1929 | March 1933 |
| May 1937 | June 1938 |
| February 1945 | October 1945 |
| November 1948 | October 1949 |
| July 1953 | May 1954 |
| August 1957 | April 1958 |
| April 1960 | February 1961 |
| December 1969 | November 1970 |
| November 1973 | March 1975 |
| January 1980 | July 1980 |
| July 1981 | November 1982 |
| July 1990 | March 1991 |
| March 2001 | November 2001 |
| December 2007 | June 2009 |
|
Data from: National Bureau of Economic Research. |
|
FOR INQUIRING MINDSDefining Recessions and Expansions
You may be wondering how recessions and expansions are defined. The truth is that there are no exact definitions!
In many countries, economists adopt the rule that a recession is a period of at least two consecutive quarters (a quarter is three months) during which the total output of the economy shrinks. The two-
Sometimes, however, this seems too strict. For example, three months of sharply declining output, then three months of slightly positive growth, then another three months of rapid decline, should surely be considered to have endured a nine-
In the United States, we assign the task of determining when a recession begins and ends to an independent panel of experts at the National Bureau of Economic Research (NBER). This panel looks at a variety of economic indicators, with the main focus on employment and production. But, ultimately, the panel makes a judgment call.
Sometimes this judgment is controversial. In fact, there is lingering controversy over the 2001 recession. According to the NBER, that recession began in March 2001 and ended in November 2001 when output began rising. Some critics argue, however, that the recession really began several months earlier, when industrial production began falling. Other critics argue that the recession didn’t really end in 2001 because employment continued to fall and the job market remained weak for another year and a half. 
The Pain of Recession
Not many people complain about the business cycle when the economy is expanding. Recessions, however, create a great deal of pain.
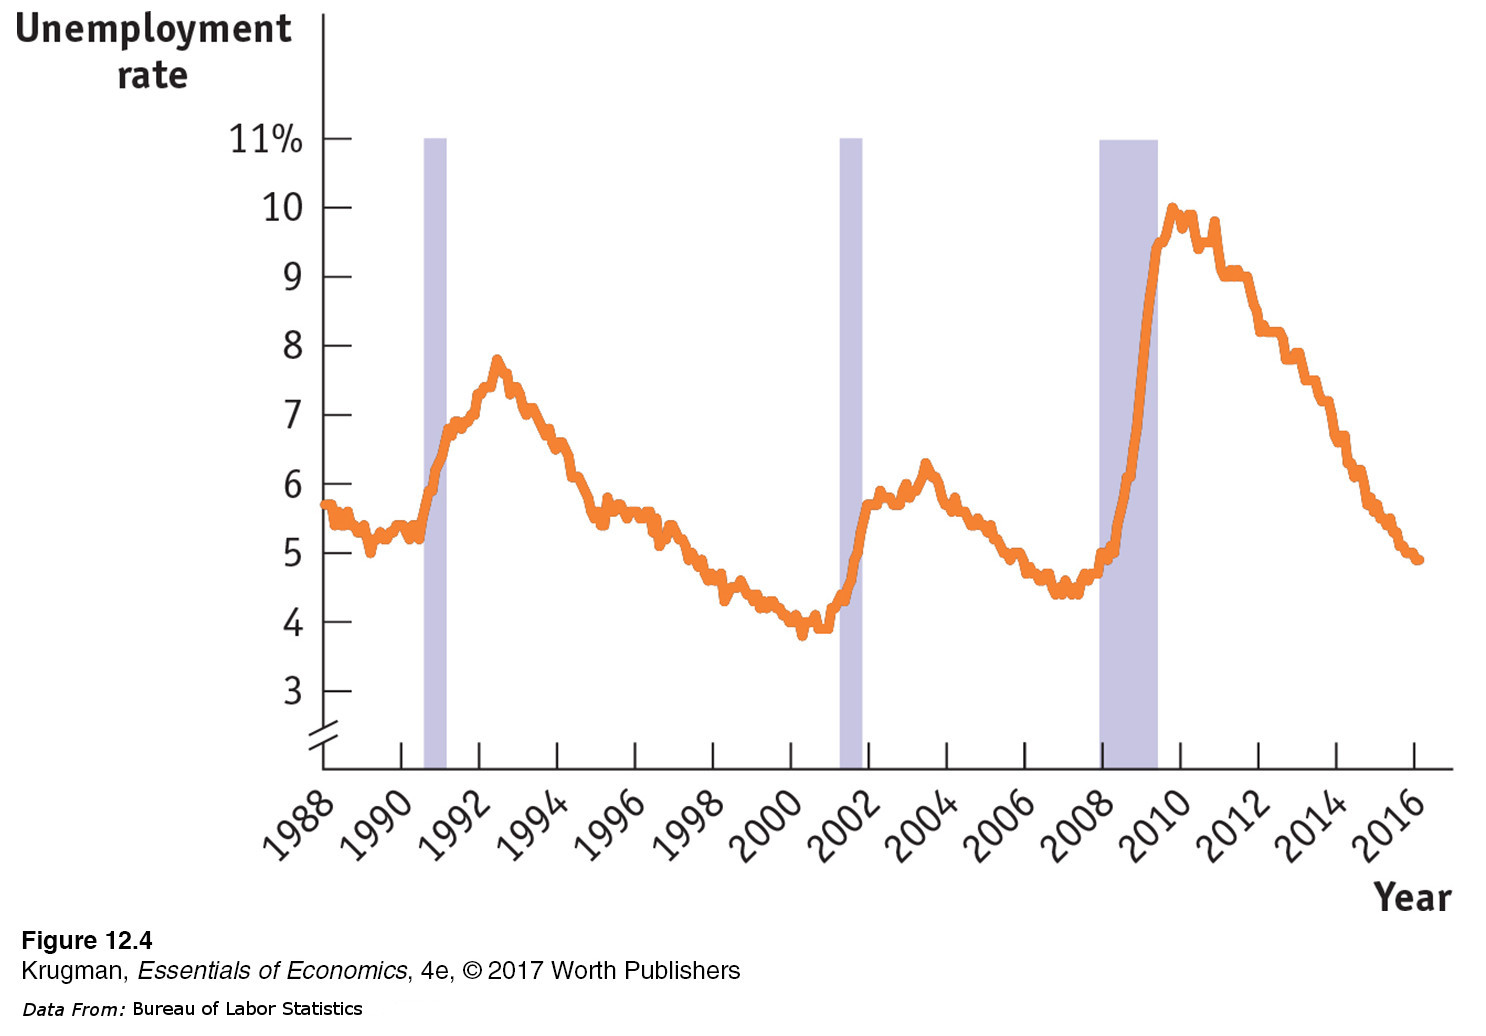
The most important effect of a recession is its effect on the ability of workers to find and hold jobs. The most widely used indicator of conditions in the labor market is the unemployment rate. We’ll explain how that rate is calculated in Chapter 14, but for now it’s enough to say that a high unemployment rate tells us that jobs are scarce and a low unemployment rate tells us that jobs are easy to find.
Figure 12-4 shows the unemployment rate from 1988 to 2016. As you can see, the U.S. unemployment rate surged during and after each recession but eventually fell during periods of expansion. The rising unemployment rate in 2008 was a sign that a new recession might be under way, which was later confirmed by the NBER to have begun in December 2007.
Because recessions cause many people to lose their jobs and make it hard to find new ones, they hurt the standard of living of many families. Recessions are usually associated with a rise in the number of people living below the poverty line, an increase in the number of people who lose their houses because they can’t afford the mortgage payments, and a fall in the percentage of Americans with health insurance coverage.
You should not think, however, that workers are the only group that suffers during a recession. Recessions are also bad for firms: like employment and wages, profits suffer during recessions, with many small businesses failing.
All in all, then, recessions are bad for almost everyone. Can anything be done to reduce their frequency and severity?
Taming the Business Cycle
Modern macroeconomics largely came into being as a response to the worst recession in history—

As explained earlier, the work of John Maynard Keynes suggested that monetary and fiscal policies could be used to mitigate the effects of recessions, and to this day governments turn to Keynesian policies when recession strikes. Later work, notably that of another great macroeconomist, Milton Friedman, led to a consensus that it’s important to rein in booms as well as to fight slumps. So modern policy makers try to “smooth out” the business cycle. They haven’t been completely successful, as a look back at Figure 12-2 makes clear. It’s widely believed, however, that policy guided by macroeconomic analysis has helped make the economy more stable.
Although the business cycle is one of the main concerns of macroeconomics and historically played a crucial role in fostering the development of the field, macroeconomists are also concerned with other issues we examine next.
ECONOMICS in Action
Comparing Recessions
The alternation of recessions and expansions seems to be an enduring feature of economic life. However, not all business cycles are created equal. In particular, some recessions have been much worse than others.
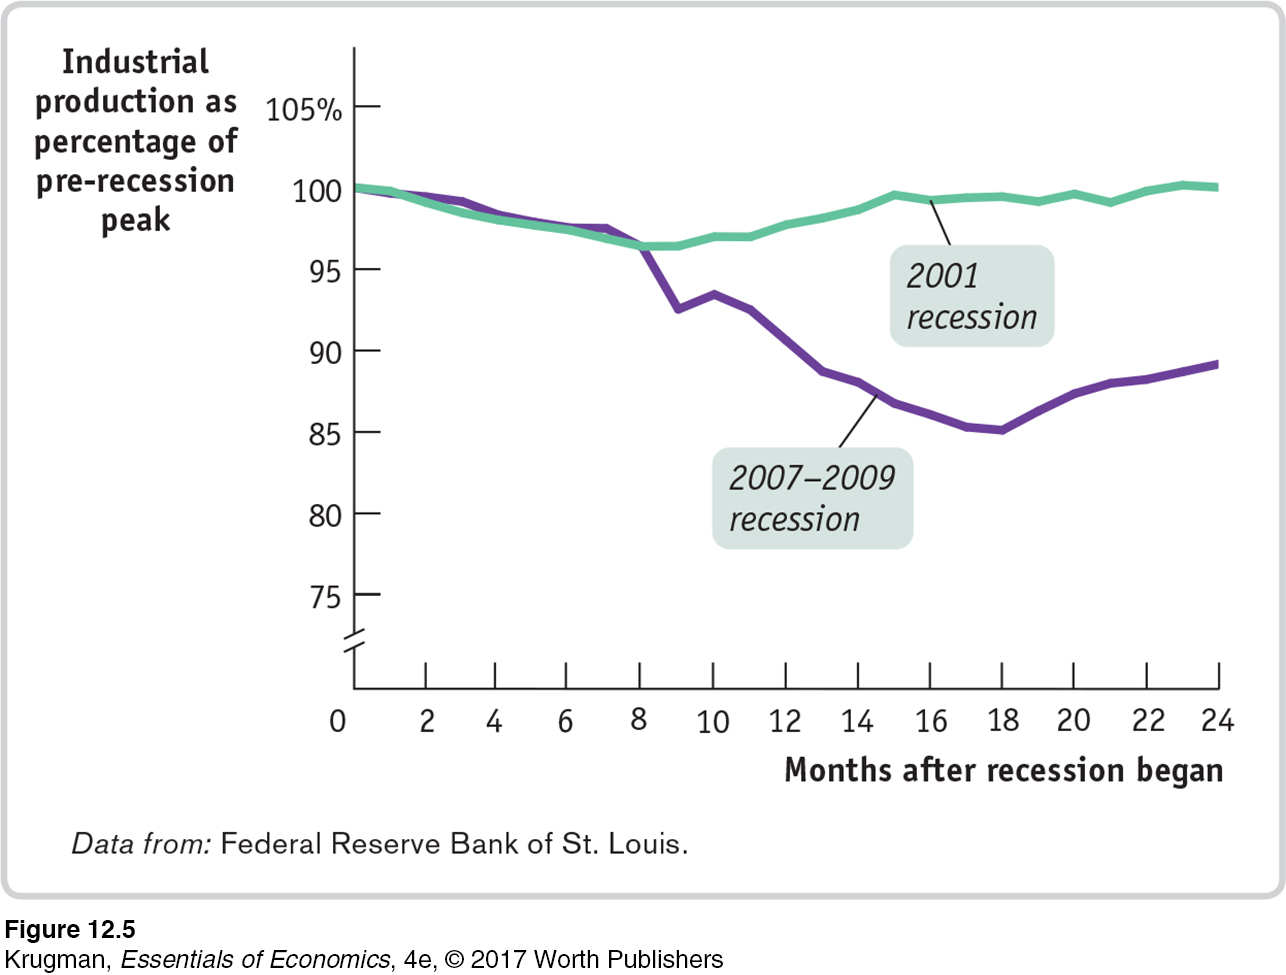
Let’s compare the two most recent U.S. recessions: the 2001 recession and the Great Recession of 2007–2009. These recessions differed in duration: the first lasted only eight months, the second more than twice as long. Even more important, however, they differed greatly in depth.
In Figure 12-5 we compare the depth of the recessions by looking at what happened to industrial production over the months after the recession began. In each case, production is measured as a percentage of its level at the recession’s start. Thus the line for the 2007–2009 recession shows that industrial production eventually fell to about 85% of its initial level.
Clearly, the 2007–2009 recession hit the economy vastly harder than the 2001 recession. Indeed, by comparison to many recessions, the 2001 slump was very mild.
Of course, this was no consolation to the millions of American workers who lost their jobs, even in that mild recession.
Quick Review
The business cycle, the short-
run alternation between recessions and expansions, is a major concern of modern macroeconomics. The point at which expansion shifts to recession is a business-
cycle peak. The point at which recession shifts to expansion is a business-cycle trough.
Check Your Understanding 12-2
Question 12.3
1. Why do we talk about business cycles for the economy as a whole, rather than just talking about the ups and downs of particular industries?
We talk about business cycles for the economy as a whole because recessions and expansions are not confined to a few industries—
Question 12.4
2. Describe who gets hurt in a recession, and how.
Recessions cause a great deal of pain across the entire society. They cause large numbers of workers to lose their jobs and make it hard to find new jobs. Recessions hurt the standard of living of many families and are usually associated with a rise in the number of people living below the poverty line, an increase in the number of people who lose their houses because they can’t afford their mortgage payments, and a fall in the percentage of Americans with health insurance. Recessions also hurt the profits of firms.
Solutions appear at back of book.