14.3 Solved Problem
SOLVED PROBLEM The Current Population Survey
![]() for interactive tutorials with step-
for interactive tutorials with step-
399
Every month, the U.S. Census Bureau surveys about 60,000 American households to gather information about the U.S. labor force for the Bureau of Labor Statistics. The survey, known as the Current Population Survey (CPS), provides information about employment, unemployment, earnings, work hours, and more. Once these data are collected, researchers at the Bureau of Labor Statistics publish a number of tables describing their findings. Please complete the following table and analyze the trend in the unemployment rate, the employment-
| Oct. 2014 (thousands) |
August 2015 (thousands) |
Sept. 2015 (thousands) |
Oct. 2015 (thousands) |
|
| Civilian noninstitutional population | 248,657 | 251,096 | 251,325 | 251,541 |
| Civilian labor force | 156,243 | 157,065 | 156,715 | 157,028 |
| Labor force participation rate | ? | ? | ? | ? |
| Employed | 147,260 | 149,036 | 148,800 | 149,120 |
| Employment- |
? | ? | ? | ? |
| Unemployed | 8,983 | 8,029 | 7,915 | 7,908 |
| Unemployment rate | ? | ? | ? | ? |
| Not in labor force | 92,414 | 94,031 | 94,610 | 94,513 |
STEP | 1 Complete the table.Read pages 378–379 and use Equations 14-
Equations 14-

This is the completed table.
| Oct. 2014 (thousands) |
August 2015 (thousands) |
Sept. 2015 (thousands) |
Oct. 2015 (thousands) |
|
| Civilian noninstitutional population | 248,657 | 251,096 | 251,325 | 251,541 |
| Civilian labor force | 156,243 | 157,065 | 156,715 | 157,028 |
| Labor force participation rate | 62.8% | 62.6% | 62.4% | 62.4% |
| Employed | 147,260 | 149,036 | 148,800 | 149,120 |
| Employment- |
59.2% | 59.4% | 59.2% | 59.3% |
| Unemployed | 8,983 | 8,029 | 7,915 | 7,903 |
| Unemployment rate | 5.7% | 5.1% | 5.1% | 5.0% |
| Not in labor force | 92,414 | 94.031 | 94,610 | 94,513 |
As shown in Equation 14-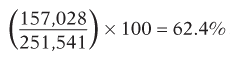 . As shown in Equation 14-
 . The employment-
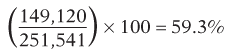 .
.
400
STEP | 2 Analyze the trend in the unemployment rate, the employment-
Both the unemployment rate and the labor force participation rate have steadily decreased over this period. The employment-