19.3 Money and Interest Rates
The Federal Open Market Committee decided today to lower its target for the federal funds rate 75 basis points to 2¼ percent.
Recent information indicates that the outlook for economic activity has weakened further. Growth in consumer spending has slowed and labor markets have softened. Financial markets remain under considerable stress, and the tightening of credit conditions and the deepening of the housing contraction are likely to weigh on economic growth over the next few quarters.
So read the beginning of a press release from the Federal Reserve issued on March 18, 2008. (A basis point is equal to 0.01 percentage point. So the statement implies that the Fed lowered the target from 3% to 2.25%.) We learned about the federal funds rate in the previous chapter: it’s the rate at which banks lend reserves to each other to meet the required reserve ratio. As the statement implies, at each of its eight-
As we’ve already seen, other short-
How does the Fed go about achieving a target federal funds rate? And more to the point, how is the Fed able to affect interest rates at all?
The Equilibrium Interest Rate
According to the liquidity preference model of the interest rate, the interest rate is determined by the supply and demand for money.
The money supply curve shows how the quantity of money supplied varies with the interest rate.
Recall that, for simplicity, we’re assuming there is only one interest rate paid on nonmonetary financial assets, both in the short run and in the long run. To understand how the interest rate is determined, consider Figure 19-3, which illustrates the liquidity preference model of the interest rate; this model says that the interest rate is determined by the supply and demand for money in the market for money. Figure 19-3 combines the money demand curve, MD, with the money supply curve, MS, which shows how the quantity of money supplied by the Federal Reserve varies with the interest rate.
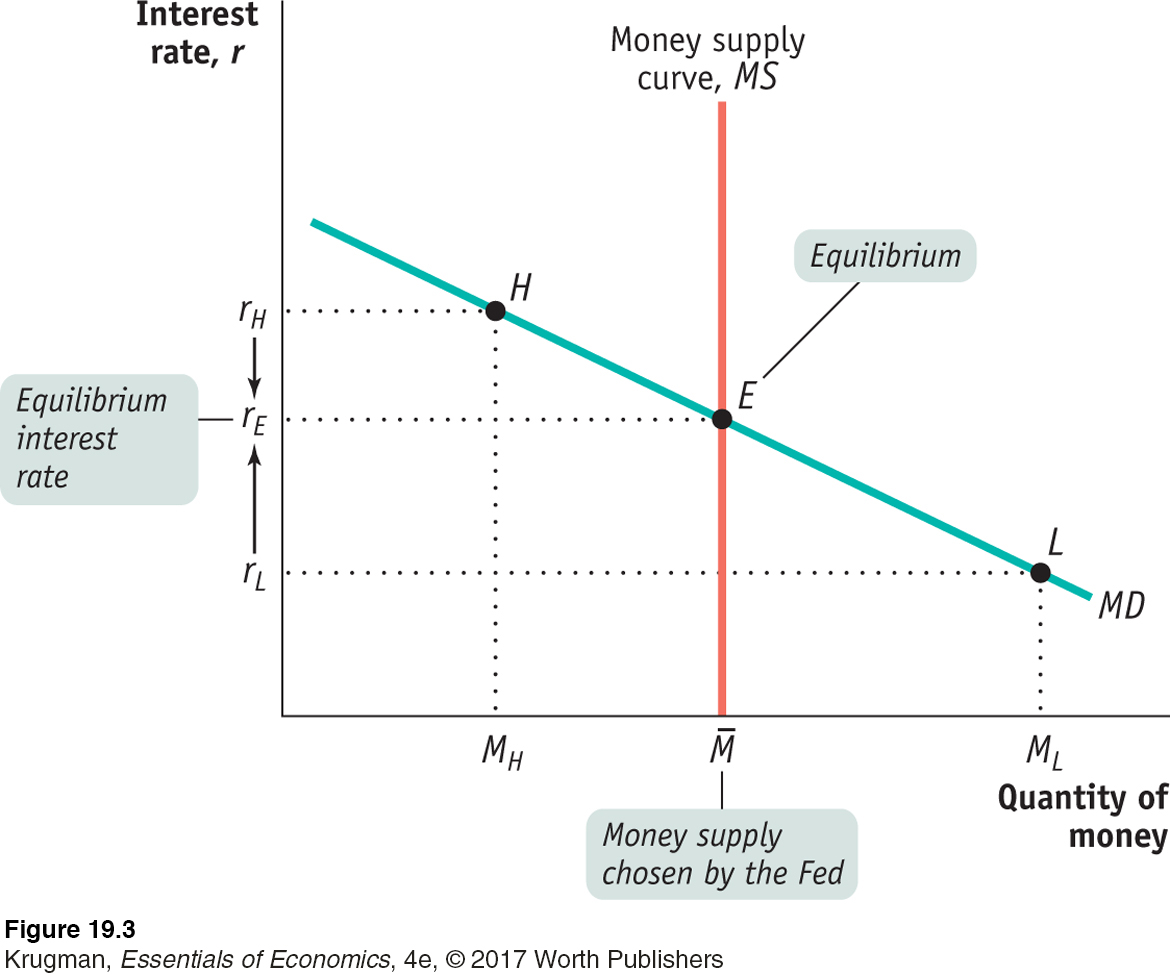
 . The money market is in equilibrium at the interest rate rE: the quantity of money demanded by the public is equal to
, the quantity of money supplied. At a point such as L, the interest rate, rL, is below rE and the corresponding quantity of money demanded, ML, exceeds the money supply,
. In an attempt to shift their wealth out of nonmoney interest-
. In an attempt to shift out of money holdings into nonmoney interest-
. The money market is in equilibrium at the interest rate rE: the quantity of money demanded by the public is equal to
, the quantity of money supplied. At a point such as L, the interest rate, rL, is below rE and the corresponding quantity of money demanded, ML, exceeds the money supply,
. In an attempt to shift their wealth out of nonmoney interest-
. In an attempt to shift out of money holdings into nonmoney interest-548
As we’ve learned, the Federal Reserve can increase or decrease the money supply: it usually does this through open- . The money market equilibrium is at E, where MS and MD cross. At this point the quantity of money demanded equals the money supply,
, leading to an equilibrium interest rate of rE.
. The money market equilibrium is at E, where MS and MD cross. At this point the quantity of money demanded equals the money supply,
, leading to an equilibrium interest rate of rE.
To understand why rE is the equilibrium interest rate, consider what happens if the money market is at a point like L, where the interest rate, rL, is below rE. At rL the public wants to hold the quantity of money ML, an amount larger than the actual money supply,
. This means that at point L, the public wants to shift some of its wealth out of interest-
This result has two implications. One is that the quantity of money demanded is more than the quantity of money supplied. The other is that the quantity of interest-
. That is, the interest rate will rise until it is equal to rE.
Now consider what happens if the money market is at a point such as H in Figure 19-3, where the interest rate rH is above rE. In that case the quantity of money demanded, MH, is less than the quantity of money supplied,
. Correspondingly, the quantity of interest-
. Again, the interest rate will end up at rE.
549
PITFALLS
THE TARGET VERSUS THE MARKET?
Over the years, the Federal Reserve has changed the way in which monetary policy is implemented. In the late 1970s and early 1980s, it set a target level for the money supply and altered the monetary base to achieve that target. Under this operating procedure, the federal funds rate fluctuated freely. Today the Fed uses the reverse procedure, setting a target for the federal funds rate and allowing the money supply to fluctuate as it pursues that target.
A common mistake is to imagine that these changes in the way the Fed operates alter the way the money market works. That is, people sometimes say that the interest rate no longer reflects the supply and demand for money because the Fed sets the interest rate.
In fact, the money market works the same way as always: the interest rate is determined by the supply and demand for money. The only difference is that now the Fed adjusts the supply of money to achieve its target interest rate. It’s important not to confuse a change in the Fed’s operating procedure with a change in the way the economy works.
Monetary Policy and the Interest Rate
Let’s examine how the Federal Reserve can use changes in the money supply to change the interest rate. Figure 19-4 shows what happens when the Fed increases the money supply from
1 to
2. The economy is originally in equilibrium at E1, with an equilibrium interest rate of r1 and money supply,
1. An increase in the money supply by the Fed to
2 shifts the money supply curve to the right, from MS1 to MS2, and leads to a fall in the equilibrium interest rate to r2. Why? Because r2 is the only interest rate at which the public is willing to hold the quantity of money actually supplied,
2.
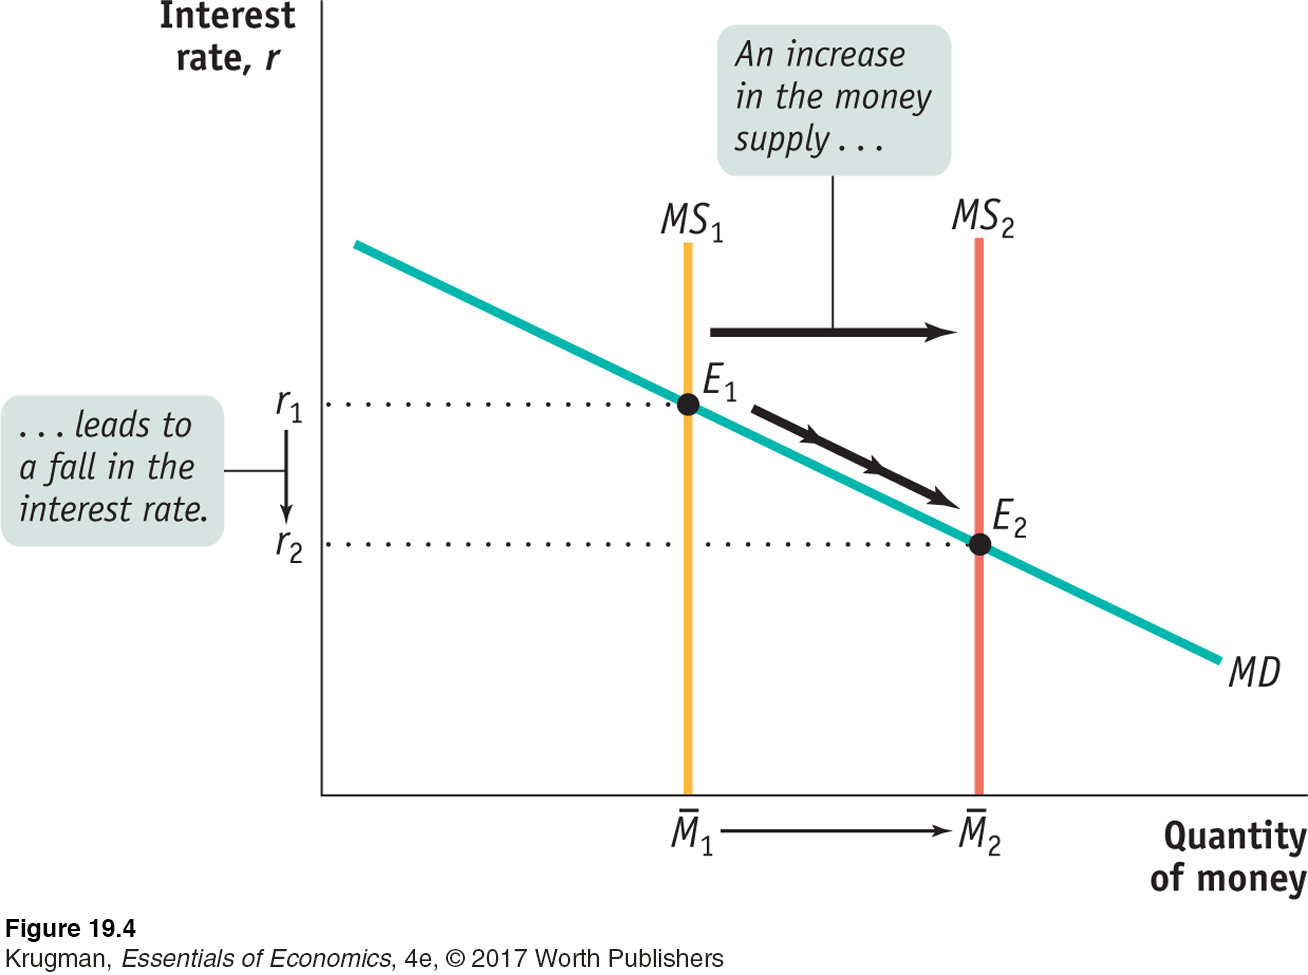 1 to
2. In order to induce people to hold the larger quantity of money, the interest rate must fall from r1 to r2.
1 to
2. In order to induce people to hold the larger quantity of money, the interest rate must fall from r1 to r2.
So an increase in the money supply drives the interest rate down. Similarly, a reduction in the money supply drives the interest rate up. By adjusting the money supply up or down, the Fed can set the interest rate.
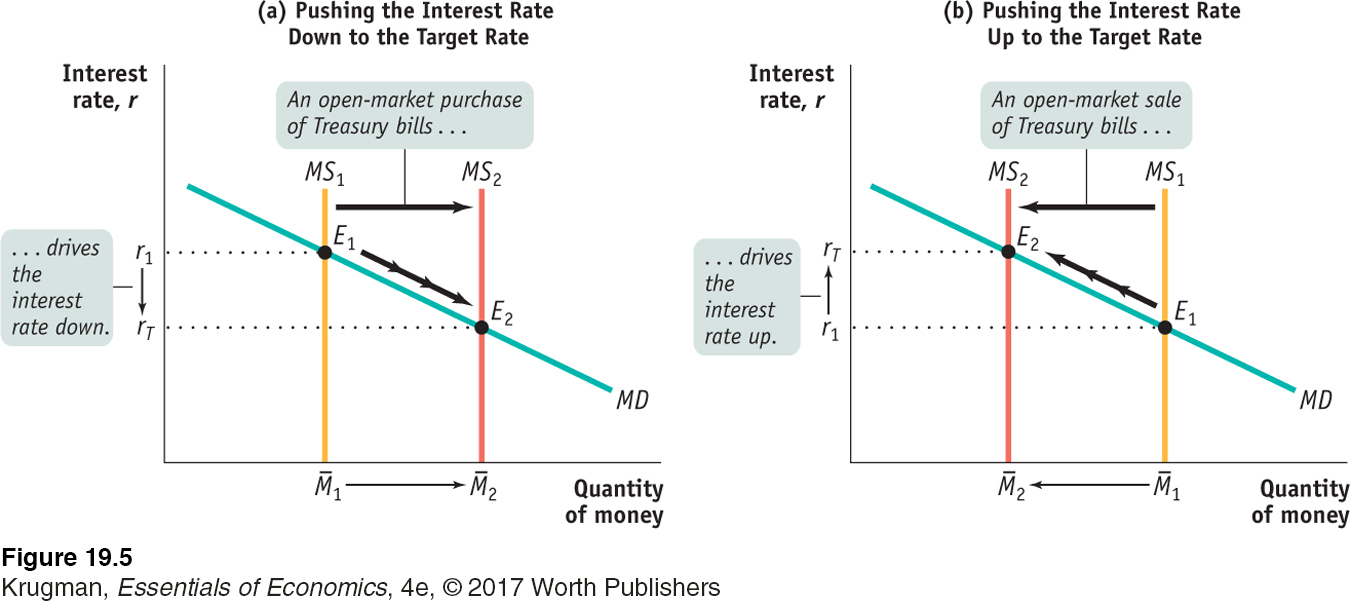
The target federal funds rate is the Federal Reserve’s desired federal funds rate.
In practice, at each meeting the Federal Open Market Committee decides on the interest rate to prevail for the next six weeks, until its next meeting. The Fed sets a target federal funds rate, a desired level for the federal funds rate. This target is then enforced by the Open Market Desk of the Federal Reserve Bank of New York—
Figure 19-5 shows how this works. In both panels, rT is the target federal funds rate. In panel (a), the initial money supply curve is MS1 with money supply
1, and the equilibrium interest rate, r1, is above the target rate. To lower the interest rate to rT, the Fed makes an open-
2. This drives the equilibrium interest rate down to the target rate, rT.
550
Panel (b) shows the opposite case. Again, the initial money supply curve is MS1 with money supply
1. But this time the equilibrium interest rate, r1, is below the target federal funds rate, rT. In this case, the Fed will make an open-
2 via the money multiplier. The money supply curve shifts leftward from MS1 to MS2, driving the equilibrium interest rate up to the target federal funds rate, rT.
Long-

Earlier we mentioned that long-
Consider the case of Millie, who has already decided to place $10,000 in U.S. government bonds for the next two years. However, she hasn’t decided whether to put the money in one-
You might think that the two-
551
The same considerations apply to all investors deciding between short-
As the example suggests, long-
This is not, however, the whole story: risk is also a factor. Return to the example of Millie, deciding whether to buy one-
This means that Millie will face extra risk if she buys two-
As we will see later in this chapter, the fact that long-
ECONOMICSin Action
The Fed Reverses Course
![]() | interactive activity
| interactive activity
We began this section with the Fed’s announcement of March 18, 2008, that it was cutting its target interest rate. This particular action was part of a larger story: a dramatic reversal of Fed policy that began in September 2007.
Figure 19-6 shows two interest rates from the beginning of 2004 through March 2016: the target federal funds rate, decided by the Federal Open Market Committee, and the effective, or actual, rate in the market. As you can see, the Fed raised its target rate in a series of steps from late 2004 until the middle of 2006. It did this to head off the possibility of an overheating economy and rising inflation. But the Fed dramatically reversed course beginning in September 2007, as falling housing prices triggered a growing financial crisis and ultimately a severe recession. And in December 2008, the Fed decided to allow the federal funds rate to move inside a target band between 0% and 0.25%.
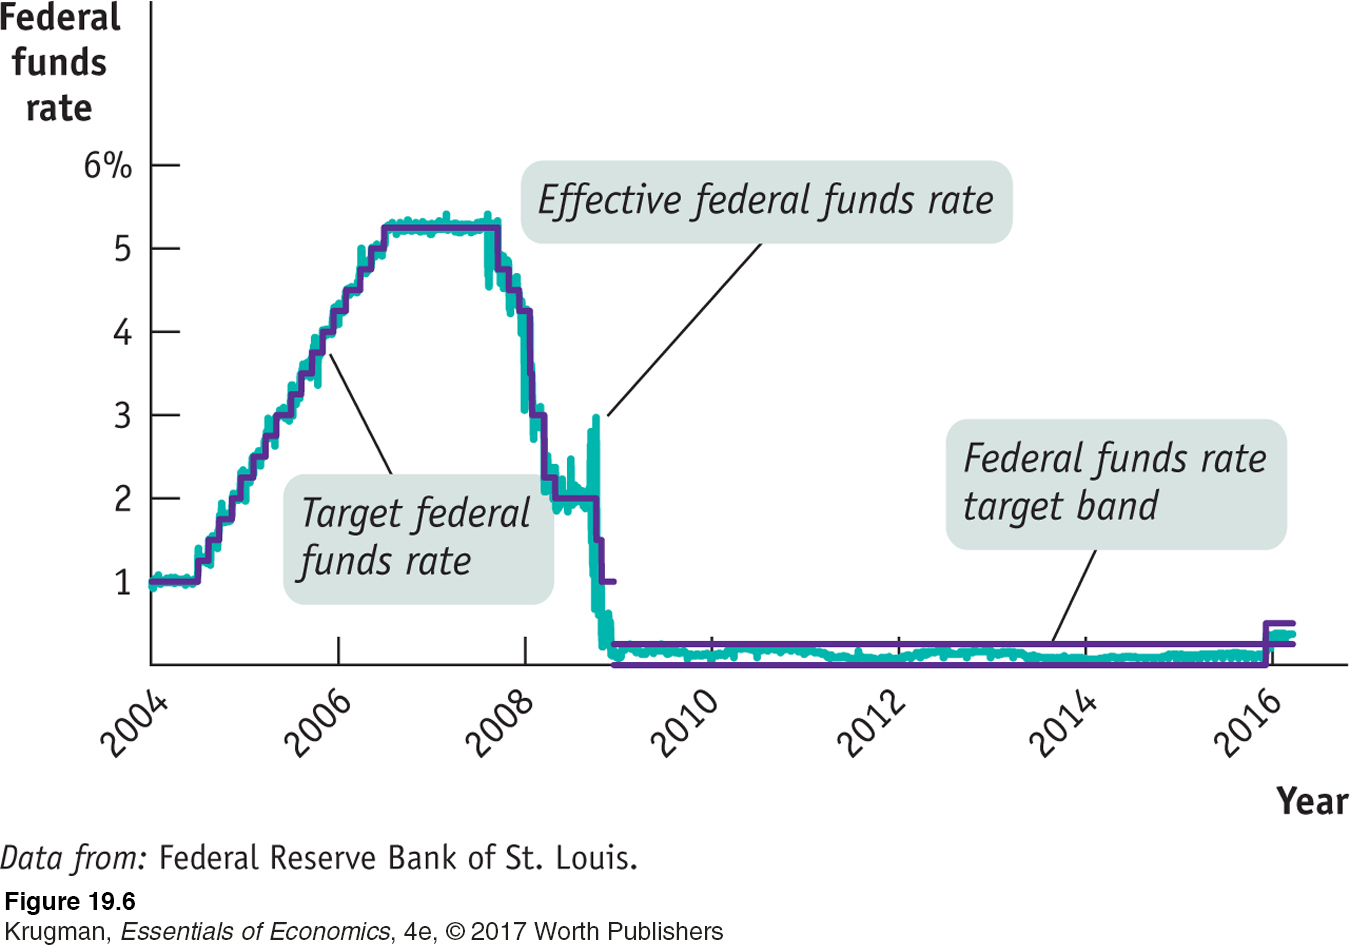
It wasn’t until December 2015 that the Fed decided the economy had recovered sufficiently to let the federal funds rate increase to a new target between 0.25% and 0.50%.
Figure 19-6 also shows that the Fed doesn’t always hit its target. There were a number of days, especially in 2008, when the effective federal funds rate was significantly above or below the target rate. But these episodes didn’t last long, and overall the Fed got what it wanted, at least as far as short-
552
Quick Review
According to the liquidity preference model of the interest rate, the equilibrium interest rate is determined by the money demand curve and the money supply curve.
The Federal Reserve can move the interest rate through open-
market operations that shift the money supply curve. In practice, the Fed sets a target federal funds rate and uses open- market operations to achieve that target. Long-
term interest rates reflect expectations about what’s going to happen to short- term rates in the future. Because of risk, long- term interest rates tend to be higher than short- term rates.
Check Your Understanding19-
Question 19.3
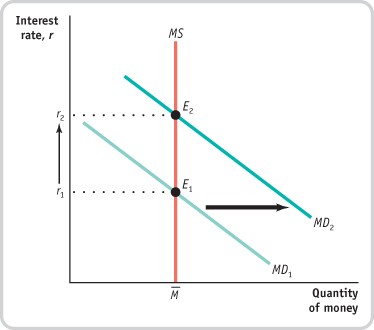
1. Assume that there is an increase in the demand for money at every interest rate. Using a diagram, show what effect this will have on the equilibrium interest rate for a given money supply.
In the accompanying diagram, the increase in the demand for money is shown as a rightward shift of the money demand curve, from MD1 to MD2. This raises the equilibrium interest rate from r1 to r2.
Question 19.4
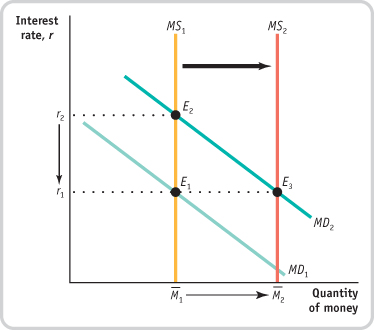
2. Now assume that the Fed is following a policy of targeting the federal funds rate. What will the Fed do in the situation described in Question 1 to keep the federal funds rate unchanged? Illustrate with a diagram.
In order to prevent the interest rate from rising, the Federal Reserve must make an open-
Question 19.5
3. Frannie must decide whether to buy a one-
This year, the interest on a one-
year bond is 4%; next year, it will be 10%. The interest rate on a two- year bond is 5%. Frannie is better off buying a one-
year bond today and a one- year bond next year because this allows her to get the higher interest rate one year from now. This year, the interest rate on a one-
year bond is 4%; next year, it will be 1%. The interest rate on a two- year bond is 3%. Frannie is better off buying a two-
year bond today because it gives her a higher interest rate in the second year than if she bought two one- year bonds.
Solutions appear at back of book.