19.6 Solved Problem
SOLVED PROBLEMThe Great Mistake of 1937
![]() for interactive tutorials with step-
for interactive tutorials with step-
In 1937, policy makers at the Fed and in the Roosevelt administration decided that the Great Depression that began in 1929 was over. They believed that the economy no longer needed special support and began phasing out the policies they instituted in the early years of the decade. Spending was cut back, and monetary policy was tightened. The result was a serious relapse in 1938, referred to at the time as the “second Great Depression.”
Many economists think that this setback was caused by the policy makers who pulled back too soon, tightening both fiscal and monetary policy, before the economy was on the path to full recovery. Everything else being equal, a tightening of monetary policy causes a drop in GDP. If the economy is starting to heat up and a boom is on its way, this tightening can be important to preventing inflation. But, if the economy is in a fragile state, a tightening of monetary policy can make things worse by decreasing GDP even further.
Using the liquidity preference model and the AD-
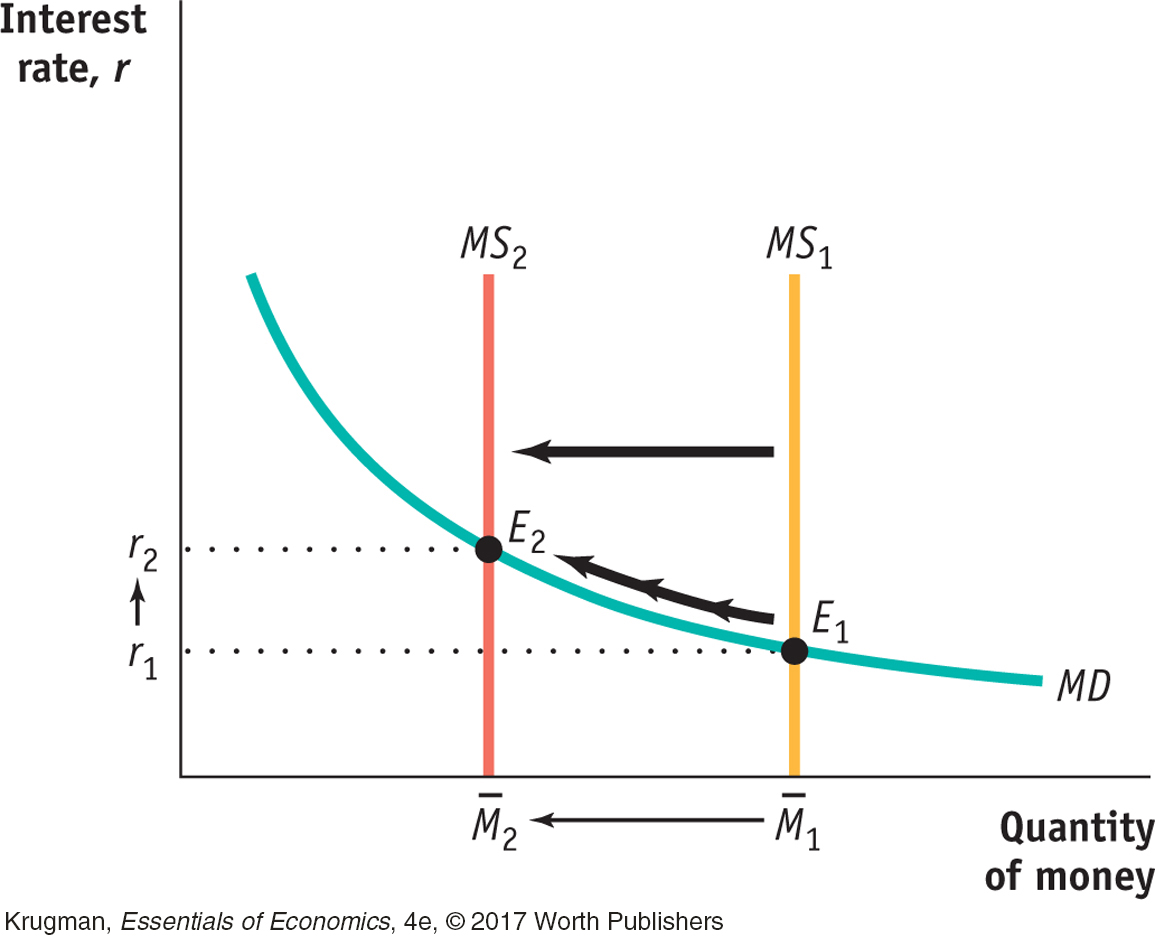
STEP | 1 Draw the money demand curve, MD, and the money supply curve, MS, in order to show how the liquidity preference model predicts that a decrease in the money supply raises interest rates.Review pages 547–549.
A decrease in the money supply shifts the MS curve to the left, from  1 to
2, as in the diagram at right. The interest rate increases from r1 to r2 because of the downward sloping money demand curve.
1 to
2, as in the diagram at right. The interest rate increases from r1 to r2 because of the downward sloping money demand curve.
STEP | 2 Draw the short-
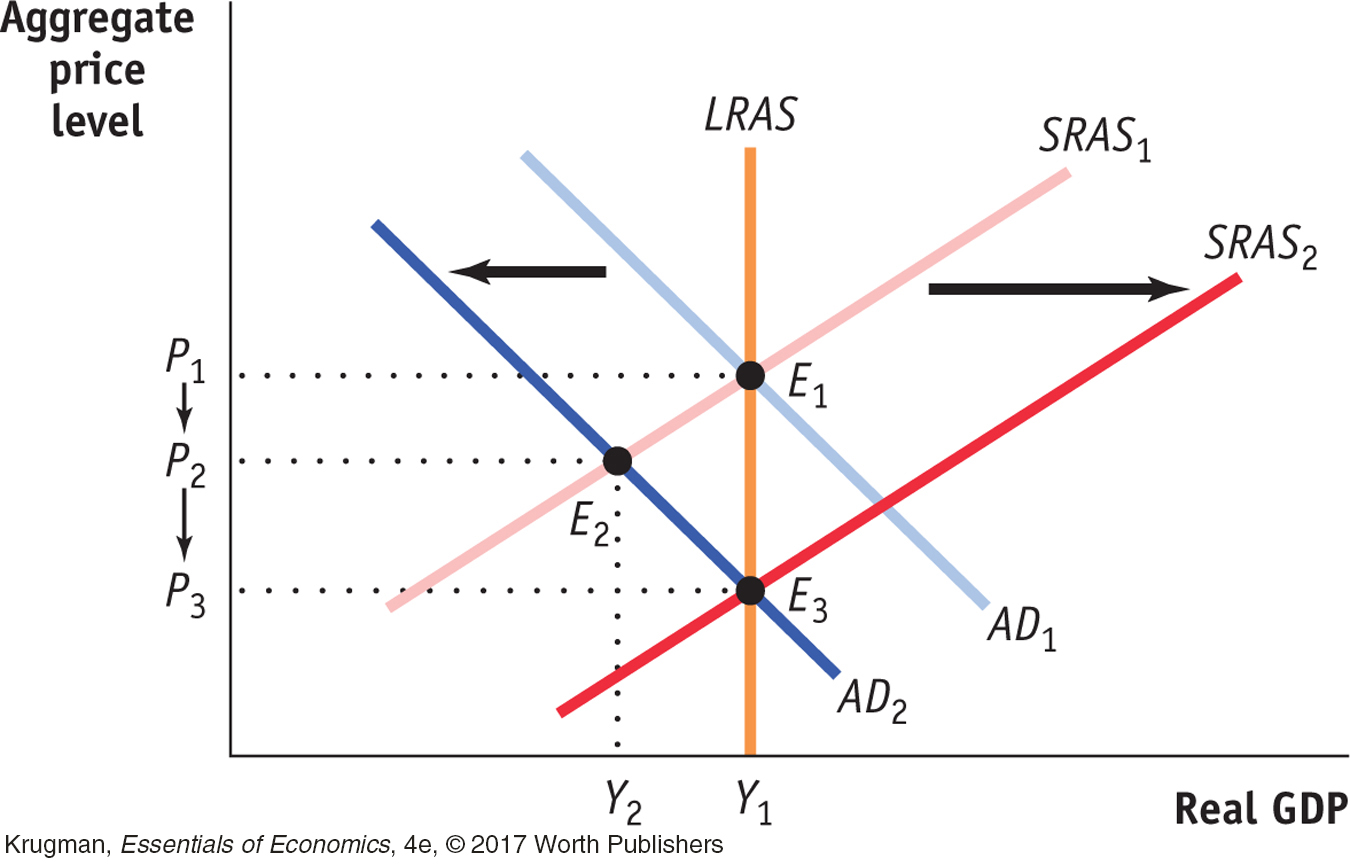
Other things being equal, a decrease in the money supply increases the interest rate, which reduces investment spending and leads to a further fall in consumer spending. So, as shown in the diagram at right, a decrease in the money supply decreases the quantity of goods and services demanded, shifting the AD curve leftward to AD2. The price level falls from P1 to P2, and real GDP falls from Y1 to Y2.
However, the aggregate output level Y2 is below potential output. As a result, nominal wages will fall over time, causing the SRAS curve to shift rightward. Prices fall further, to P3, but GDP returns to potential output at Y1. The economy ends up at point E3, a point of both short-
So, in 1937, monetary policy simply made things worse for the economy by decreasing GDP in the short run, and putting further downward pressure on prices in the short and long run.