3.7 Solved Problem
SOLVED PROBLEMSugar, Sugar
![]() for interactive tutorials with step-
for interactive tutorials with step-
“U.S. Sugar Soars Above World Prices.” So read the headline in the Wall Street Journal in December 2014. Although the price for sugar on the international market was $0.15 per pound at the time, American buyers were paying 50% more, nearly $0.25 per pound. The impact was felt by candy companies like PEZ Candy, which purchases 75,000 pounds of sugar each week. Why was there a disparity in price?
| Quantity of sugar (millions of tons) | ||
| Price of sugar (per pound) |
Quantity demanded |
Quantity supplied |
| $0.45 | 1.6 | 2.8 |
| 0.35 | 1.8 | 2.4 |
| 0.25 | 2.0 | 2.0 |
| 0.15 | 2.2 | 1.6 |
| 0.05 | 2.4 | 1.2 |
To protect sugar farmers, the U.S. government limits the quantity of sugar that domestic buyers, like PEZ Candy, can purchase from international suppliers. These restrictions leave U.S. buyers with virtually no other choice; they have to purchase the higher-
The table is a hypothetical supply and demand schedule for the U.S. sugar market.
Use a supply and demand graph to find the equilibrium quantity and price for sugar in the United States. Show how a shortage would occur if U.S. sugar farmers were forced to set prices equal to the world price of $0.15 per pound.
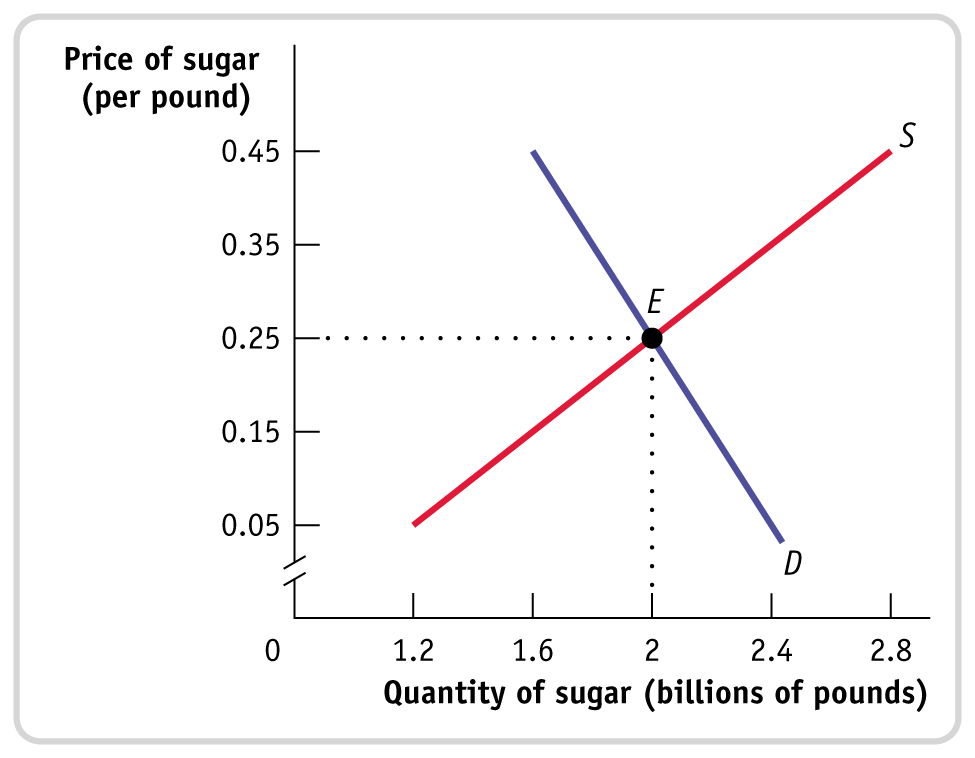
STEP | 1 Draw and label supply and demand curves. Find the equilibrium quantity demanded.
The equilibrium quantity demanded is at point E, the point at which quantity supplied equals quantity demanded. As shown both in the supply and demand schedule and in the figure, this occurs at an equilibrium quantity of 2.0 billion pounds and an equilibrium price of $0.25.
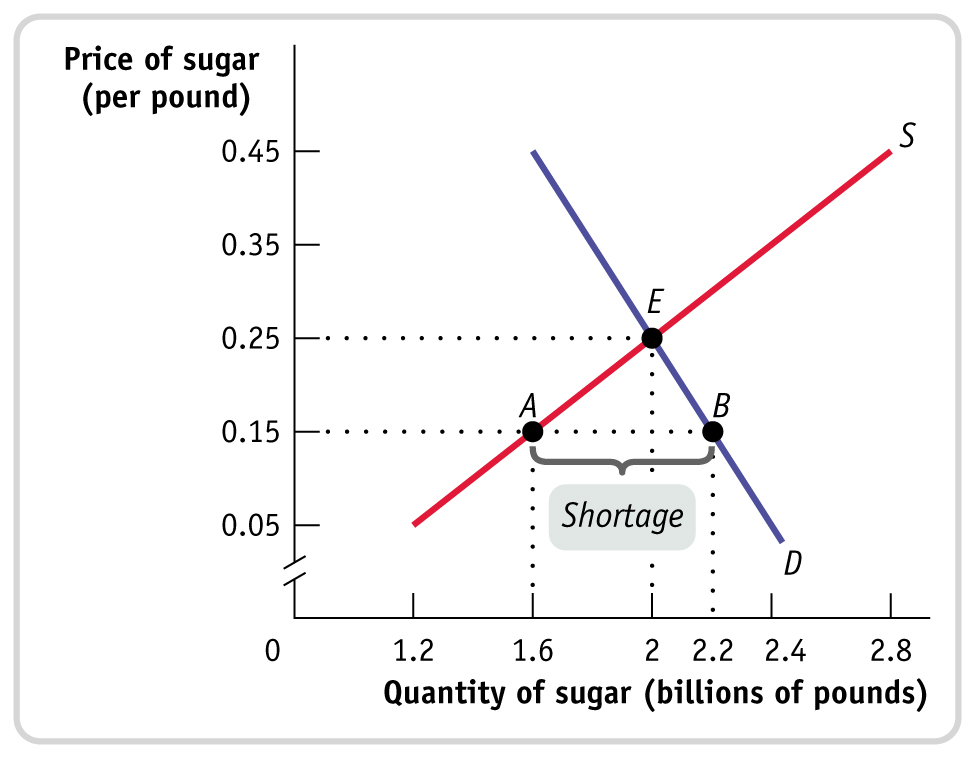
STEP | 2 Calculate the shortage of sugar that would occur at a price of $0.15.
As shown in the upcoming graph, a price of $0.15 corresponds to point A on the supply curve. The quantity supplied at a price of 0.15 can be found by starting at point A, following the dotted line down to the horizontal axis, and observing that the quantity supplied by U.S. sugar farmers is 1.6 billion pounds. Similarly, a price of $0.15 corresponds to point B on the demand curve. The quantity demanded at a price of $0.15 can be found by starting at point B, following the dotted line down to the horizontal axis, and observing that the quantity demanded is 2.2 billion pounds. The difference between the quantity demanded and the quantity supplied is 2.2 − 1.6 = 0.6 billion pounds. This difference can also be found from the supply and demand schedule. As shown in the schedule, at a price of $0.15, the quantity supplied (1.6 billion pounds) is less than the quantity demanded (2.2 billion pounds) by 0.6 billion pounds.