4.7 Controlling Quantities
124
In the 1930s, New York City instituted a system of licensing for taxicabs: only taxis with a “medallion” were allowed to pick up passengers. Because this system was intended to assure quality, medallion owners were supposed to maintain certain standards, including safety and cleanliness. A total of 11,787 medallions were issued, with taxi owners paying $10 for each medallion.
In 1995, there were still only 11,787 licensed taxicabs in New York, even though the city had meanwhile become the financial capital of the world, a place where hundreds of thousands of people in a hurry tried to hail a cab every day. An additional 400 medallions were issued in 1995, and after several rounds of sales of additional medallions, today there are 13,437 medallions. The result of this restriction is that a New York City taxi medallion is a very valuable item: if you want to operate a taxi in the city, you must lease a medallion from someone else or buy one, with a current price today of $750,000.
It turns out that this story is not unique; other cities introduced similar medallion systems in the 1930s and, like New York, have issued few new medallions since. In San Francisco and Boston, as in New York, taxi medallions trade for six-
A quantity control, or quota, is an upper limit on the quantity of some good that can be bought or sold. The total amount of the good that can be legally transacted is the quota limit.
A license gives its owner the right to supply a good.
A taxi medallion system is a form of quantity control, or quota, by which the government regulates the quantity of a good that can be bought and sold rather than the price at which it is transacted. A quota is another way—
A taxi medallion is just such a license. The government of New York City limits the number of taxi rides that can be sold by limiting the number of taxis to only those who hold medallions. There are many other cases of quantity controls, ranging from limits on how much foreign currency (for instance, British pounds or Mexican pesos) people are allowed to buy to the quantity of clams New Jersey fishing boats are allowed to catch.
In the real world, quantity controls set an upper limit on the quantity of a good that can be transacted.
Some attempts to control quantities are undertaken for good economic reasons, some for bad ones. In many cases, as we will see, quantity controls introduced to address a temporary problem become politically hard to remove later because the beneficiaries don’t want them abolished, even after the original reason for their existence is long gone. But whatever the reasons for such controls, they have certain predictable—
The Anatomy of Quantity Controls
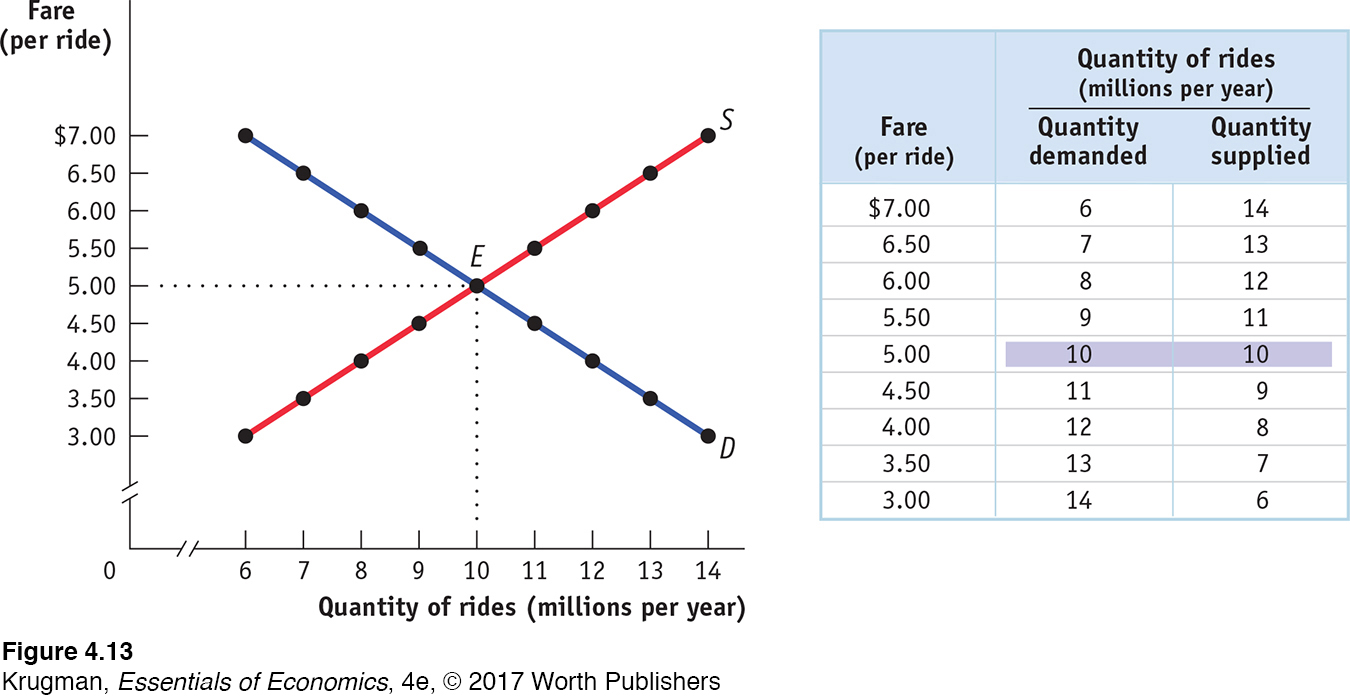
To understand why a New York taxi medallion is worth so much money, we consider a simplified version of the market for taxi rides, shown in Figure 4-13. Just as we assumed in the analysis of rent control that all apartments are the same, we now suppose that all taxi rides are the same—
The table in the figure shows supply and demand schedules. The equilibrium—
The New York medallion system limits the number of taxis, but each taxi driver can offer as many rides as he or she can manage. (Now you know why New York taxi drivers are so aggressive!) To simplify our analysis, however, we will assume that a medallion system limits the number of taxi rides that can legally be given to 8 million per year.
125
The demand price of a given quantity is the price at which consumers will demand that quantity.
Until now, we have derived the demand curve by answering questions of the form: “How many taxi rides will passengers want to take if the price is $5 per ride?” But it is possible to reverse the question and ask instead: “At what price will consumers want to buy 10 million rides per year?” The price at which consumers want to buy a given quantity—
The supply price of a given quantity is the price at which producers will supply that quantity.
Similarly, the supply curve represents the answer to questions of the form: “How many taxi rides would taxi drivers supply at a price of $5 each?” But we can also reverse this question to ask: “At what price will suppliers be willing to supply 10 million rides per year?” The price at which suppliers will supply a given quantity—
Now we are ready to analyze a quota. We have assumed that the city government limits the quantity of taxi rides to 8 million per year. Medallions, each of which carries the right to provide a certain number of taxi rides per year, are made available to selected people in such a way that a total of 8 million rides will be provided. Medallion-
Figure 4-14 shows the resulting market for taxi rides, with the black vertical line at 8 million rides per year representing the quota limit. Because the quantity of rides is limited to 8 million, consumers must be at point A on the demand curve, corresponding to the shaded entry in the demand schedule: the demand price of 8 million rides is $6 per ride. Meanwhile, taxi drivers must be at point B on the supply curve, corresponding to the shaded entry in the supply schedule: the supply price of 8 million rides is $4 per ride.
126
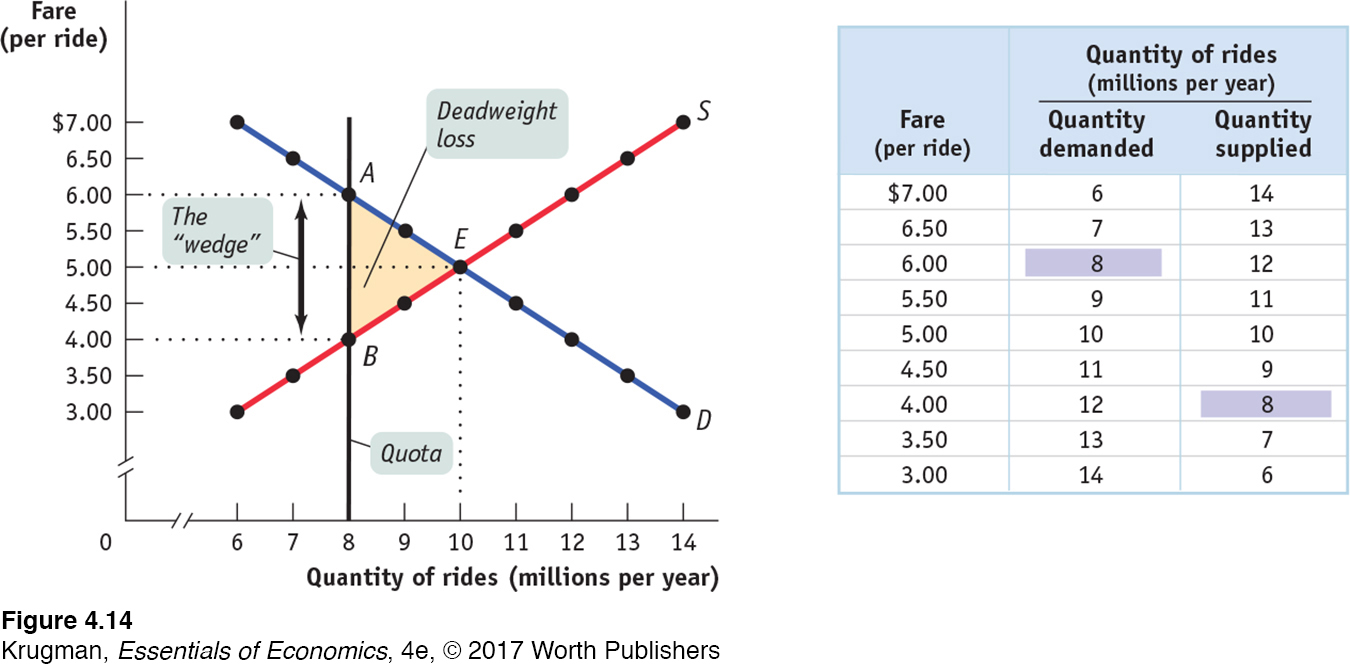
But how can the price received by taxi drivers be $4 when the price paid by taxi riders is $6? The answer is that in addition to the market in taxi rides, there is also a market in medallions. Medallion-
To see how this all works, consider two imaginary New York taxi drivers, Sunil and Harriet. Sunil has a medallion but can’t use it because he’s recovering from a severely sprained wrist. So he’s looking to rent his medallion out to someone else. Harriet doesn’t have a medallion but would like to rent one. Furthermore, at any point in time there are many other people like Harriet who would like to rent a medallion. Suppose Sunil agrees to rent his medallion to Harriet. To make things simple, assume that any driver can give only one ride per day and that Sunil is renting his medallion to Harriet for one day. What rental price will they agree on?
To answer this question, we need to look at the transactions from the viewpoints of both drivers. Once she has the medallion, Harriet knows she can make $6 per day—
127
A quantity control, or quota, drives a wedge between the demand price and the supply price of a good; that is, the price paid by buyers ends up being higher than that received by sellers.
It is no coincidence that $2 is exactly the difference between $6, the demand price of 8 million rides, and $4, the supply price of 8 million rides. In every case in which the supply of a good is legally restricted, there is a wedge between the demand price of the quantity transacted and the supply price of the quantity transacted.
The difference between the demand and supply price at the quota limit is the quota rent, the earnings that accrue to the license-
This wedge, illustrated by the double-
So Figure 4-14 also illustrates the quota rent in the market for New York taxi rides. The quota limits the quantity of rides to 8 million per year, a quantity at which the demand price of $6 exceeds the supply price of $4. The wedge between these two prices, $2, is the quota rent that results from the restrictions placed on the quantity of taxi rides in this market.
But wait a second. What if Sunil doesn’t rent out his medallion? What if he uses it himself? Doesn’t this mean that he gets a price of $6? No, not really. Even if Sunil doesn’t rent out his medallion, he could have rented it out, which means that the medallion has an opportunity cost of $2: if Sunil decides to use his own medallion and drive his own taxi rather than renting his medallion to Harriet, the $2 represents his opportunity cost of not renting out his medallion. That is, the $2 quota rent is now the rental income he forgoes by driving his own taxi.
In effect, Sunil is in two businesses—
So regardless of whether the medallion owner uses the medallion himself or herself, or rents it to others, it is a valuable asset. And this is represented in the going price for a New York City taxi medallion: in 2015, New York City taxi medallions sold for $700,000 to $800,000. According to Simon Greenbaum, a broker of New York taxi medallions, an owner of a medallion who leases it to a driver can expect to earn about $2,500 per month, or a 3% return—
Notice, by the way, that quotas—
The Costs of Quantity Controls
Like price controls, quantity controls can have some predictable and undesirable side effects. The first is the by-
The same is true for the next 1 million rides: New Yorkers would be willing to pay at least $5 per ride when the quantity of rides is increased from 9 to 10 million, and taxi drivers would be willing to provide those rides as long as they got at least $5 per ride. Again, these rides would have occurred without the quota limit.
128
Only when the market has reached the unregulated market equilibrium quantity of 10 million rides are there no “missed-
Generally, as long as the demand price of a given quantity exceeds the supply price, there is a deadweight loss. A buyer would be willing to buy the good at a price that the seller would be willing to accept, but such a transaction does not occur because it is forbidden by the quota. The deadweight loss arising from the 2 million in missed-
And because there are transactions that people would like to make but are not allowed to, quantity controls generate an incentive to evade them or even to break the law. New York’s taxi industry again provides clear examples. Taxi regulation applies only to those drivers who are hailed by passengers on the street. A car service that makes prearranged pickups does not need a medallion. As a result, such hired cars provide much of the service that might otherwise be provided by taxis, as in other cities. In addition, there are substantial numbers of unlicensed cabs that simply defy the law by picking up passengers without a medallion. Because these cabs are illegal, their drivers are completely unregulated, and they generate a disproportionately large share of traffic accidents in New York City.
In fact, in 2004 the hardships caused by the limited number of New York taxis led city leaders to authorize an increase in the number of licensed taxis by 900. The city auctioned off an additional 368 medallions in 2013, bringing the total number up to the current 13,437 medallions—
But those who already owned medallions were less happy with the increase; they understood that adding new taxis would reduce or eliminate the shortage of taxis. As a result, taxi drivers anticipated a decline in their revenues because they would no longer always be assured of finding willing customers. And, in turn, the value of a medallion would fall. So to placate the medallion owners, city officials also raised taxi fares: by 25% in 2004, by a smaller percentage in 2006, and again by 17% in 2012. Although taxis are now easier to find, a ride costs more—
In sum, quantity controls typically create the following undesirable side effects:
Deadweight loss because some mutually beneficial transactions don’t occur
Incentives for illegal activities
ECONOMICS in Action
Crabbing, Quotas, and Saving Lives in Alaska
 | interactive activity
A laskan king and snow crab are considered delicacies worldwide. And crab fishing is one of the most important industries in the Alaskan economy. So many were justifiably concerned when, in 1983, the annual crab catch fell by 90% due to overfishing. In response, marine biologists set a total catch quota system, which limited the amount of crab that could be harvested annually in order to allow the crab population to return to a healthy, sustainable level.
Notice, by the way, that the Alaskan crab quota is an example of a quota that was justified by broader economic and environmental considerations—
129
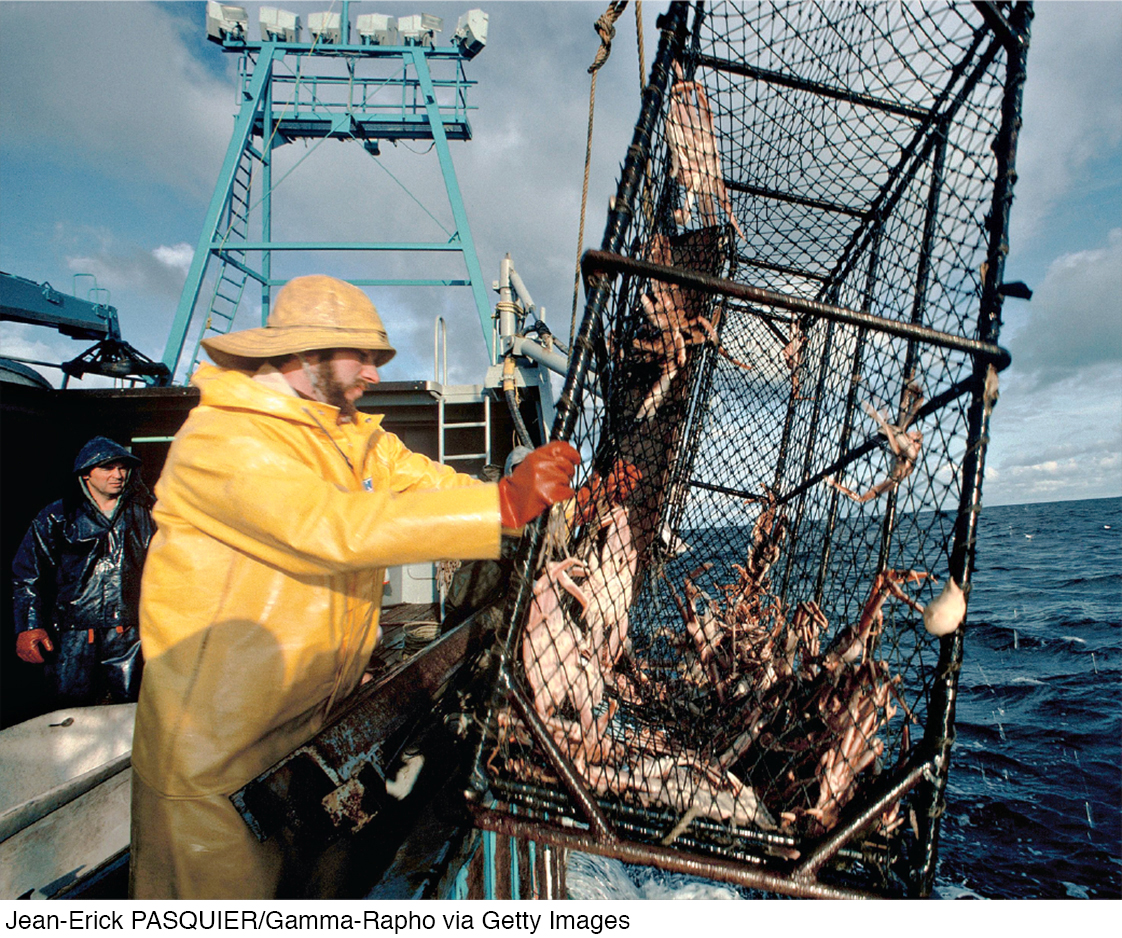
The Alaskan crabbing season is fairly short, running roughly from October to January, and it can be further shortened by bad weather. By the 1990s, Alaskan crab fishermen were engaging in “fishing derbies,” made famous by the Discovery Channel’s Deadliest Catch. To stay within the quota limit when the crabbing season began, boat crews rushed to fish for crab in dangerous, icy, rough water, straining to harvest in a few days a haul that could be worth several hundred thousand dollars. As a result, boats often became overloaded and capsized. Crews were pushed too hard, with many fatalities from hypothermia or drowning.
According to federal statistics, at the time Alaskan crab fishing was among the most dangerous of jobs, with an average of 7.3 deaths a year, about 80 times the fatality rate for an average worker. And after the brief harvest, the market for crab was flooded with supply, lowering the prices fishermen received.
In 2006 fishery regulators instituted another quota system called quota share—
In addition, by extending the fishing season, the quota-
Predictably, an Alaskan crab fisherman earns more money under the quota-
Quick Review
Quantity controls, or quotas, are government-
imposed limits on how much of a good may be bought or sold. The quantity allowed for sale is the quota limit. The government then issues a license—the right to sell a given quantity of a good under the quota. When the quota limit is smaller than the equilibrium quantity in an unregulated market, the demand price is higher than the supply price—there is a wedge between them at the quota limit.
This wedge is the quota rent, the earnings that accrue to the license-
holder from ownership of the right to sell the good— whether by actually supplying the good or by renting the license to someone else. The market price of a license equals the quota rent. Like price controls, quantity controls create deadweight loss and encourage illegal activity.
Check Your Understanding 4-
Question 4.7
1. Suppose that the supply and demand for taxi rides is given by Figure 4-13 but the quota is set at 6 million rides instead of 8 million. Find the following and indicate them on Figure 4-13.
The price of a ride
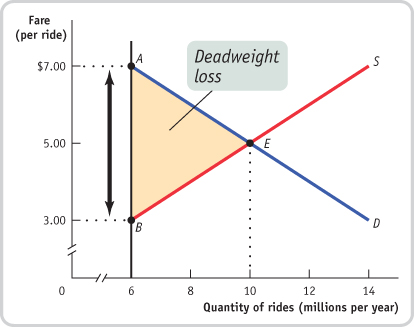
The price of a ride is $7 since the quantity demanded at this price is 6 million: $7 is the demand price of 6 million rides. This is represented by point A in the accompanying figure.
The quota rent
At 6 million rides, the supply price is $3 per ride, represented by point B in the figure. The wedge between the demand price of $7 per ride and the supply price of $3 per ride is the quota rent per ride, $4. This is represented in the figure above by the vertical distance between points A and B.
The deadweight loss
The quota discourages 4 million mutually beneficial transactions. The shaded triangle in the figure represents the deadweight loss.
Suppose the quota limit on taxi rides is increased to 9 million. What happens to the quota rent? To the deadweight loss?
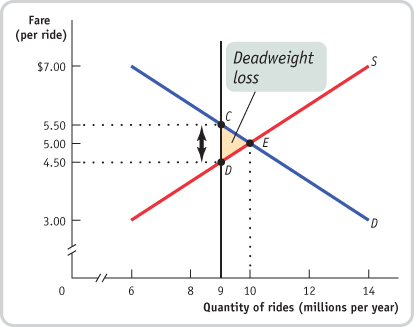
At 9 million rides, the demand price is $5.50 per ride, indicated by point C in the accompanying figure, and the supply price is $4.50 per ride, indicated by point D. The quota rent is the difference between the demand price and the supply price: $1. The deadweight loss is represented by the shaded triangle in the figure. As you can see, the deadweight loss is smaller when the quota is set at 9 million rides than when it is set at 6 million rides.
Question 4.8
2. Assume that the quota limit is 8 million rides. Suppose demand decreases due to a decline in tourism. What is the smallest parallel leftward shift in demand that would result in the quota no longer having an effect on the market? Illustrate your answer using Figure 4-13.
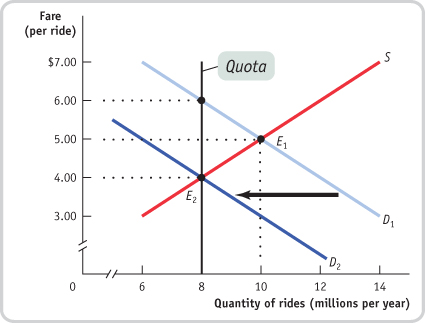
The accompanying figure shows a decrease in demand by 4 million rides, represented by a leftward shift of the demand curve from D1 to D2: at any given price, the quantity demanded falls by 4 million rides. (For example, at a price of $5, the quantity demanded falls from 10 million to 6 million rides per year.) This eliminates the effect of a quota limit of 8 million rides. At point E2, the new market equilibrium, the equilibrium quantity is equal to the quota limit; as a result, the quota has no effect on the market.
Solutions appear at back of book.