4.8 Solved Problem
SOLVED PROBLEM The World’s Second Most Expensive City
 for interactive tutorials with step-
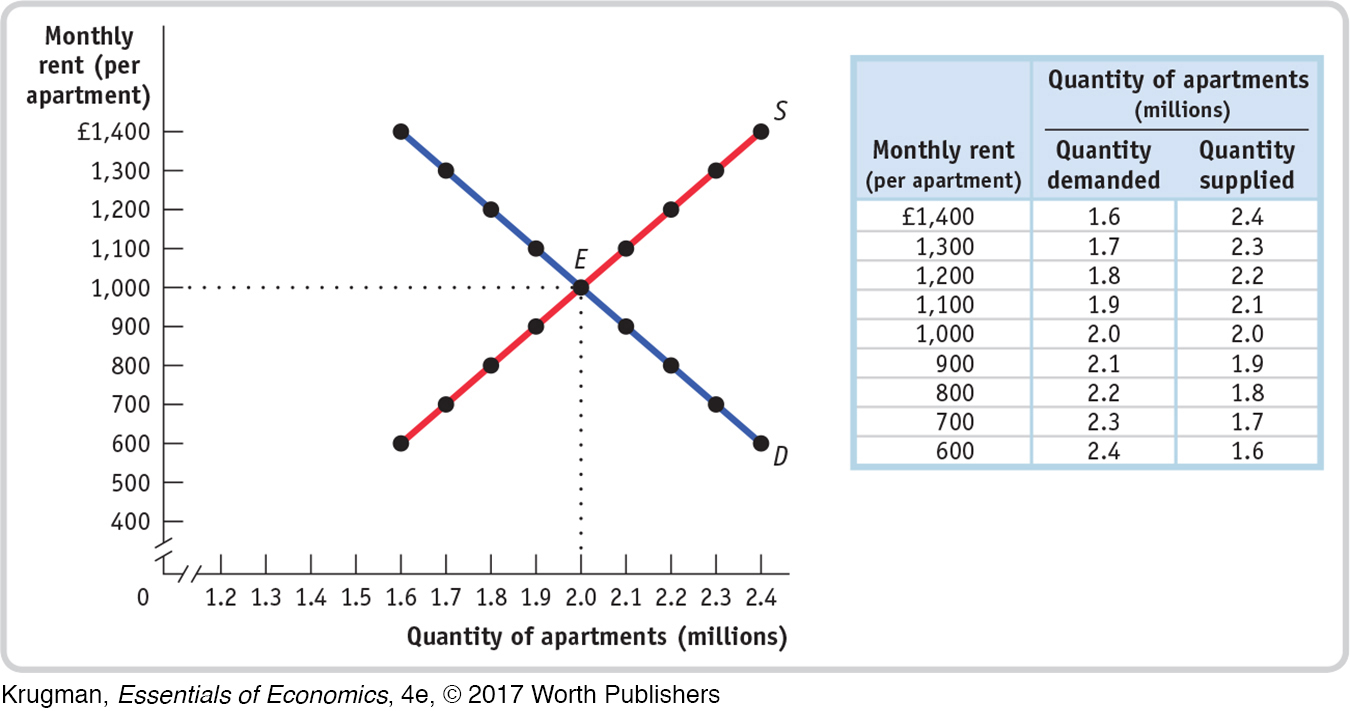
London is the second most expensive place in the world to rent an apartment (only Monte Carlo is more expensive). If you have ever visited London, you might have noticed an area around the city known as the “Green Belt.” Zoning laws make it nearly impossible to build new residential housing on land designated as the Green Belt. Consider the following hypothetical market for apartments in London in the absence of zoning controls.

This figure should look familiar to you—
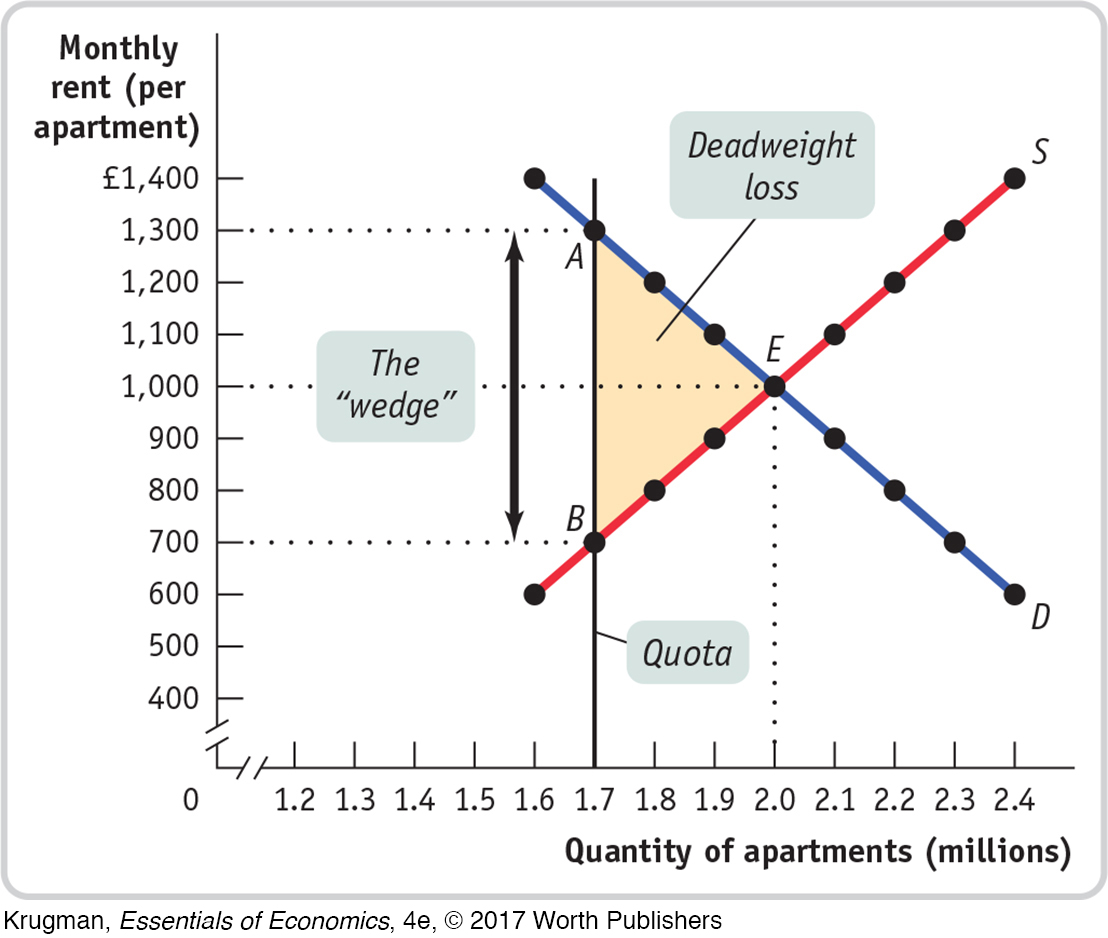
Now, let’s go back to the reality of zoning controls in the Green Belt. Use a diagram to show the effect of a quota of 1.7 million apartments. What is the quota rent, and who gets it?
STEP | 1 Use a diagram to show the effect of a quota of 1.7 million apartments. Review pages 124–128.
In this figure, the black vertical line represents the quota limit of 1.7 million apartments. Because the quantity of apartments is limited, consumers must be at point A on the demand curve. The demand price of 1.7 million apartments is £1,300 each. The supply price, corresponding to point B on the diagram, of 1.7 million apartments is only £700 each, creating a “wedge” of £1300 − £700 = £600.

STEP | 2 What is the quota rent in this case, and who gets it? Review pages 124–128.
In the case of taxis, the quota rent is the earnings that accrue to the license-