Inflation and Deflation
In January 1980 the average production worker in the United States was paid $6.57 an hour. By June 2011, the average hourly earnings for such a worker had risen to $19.41 an hour. Three cheers for economic progress!
But wait. American workers were paid much more in 2011, but they also faced a much higher cost of living. In early 1980, a dozen eggs cost only about $0.88; by June 2011, that was up to $1.68. The price of a loaf of white bread went from about $0.50 to $1.49. And the price of a gallon of gasoline rose from just $1.11 to $3.75. Figure 10-8 compares the percentage increase in hourly earnings between 1980 and 2011 with the increases in the prices of some standard items: the average worker’s paycheck went further in terms of some goods, but less far in terms of others. Overall, the rise in the cost of living wiped out many, if not all, of the wage gains of the typical worker from 1980 to 2011. In other words, once inflation is taken into account, the living standard of the typical U.S. worker has stagnated from 1980 to the present.
FIGURE 10-8 Rising Prices

A rising overall level of prices is inflation.
A falling overall level of prices is deflation.
The point is that between 1980 and 2011 the economy experienced substantial inflation: a rise in the overall level of prices. Understanding the causes of inflation and its opposite, deflation—a fall in the overall level of prices—is another main concern of macroeconomics.
The Causes of Inflation and Deflation
You might think that changes in the overall level of prices are just a matter of supply and demand. For example, higher gasoline prices reflect the higher price of crude oil, and higher crude oil prices reflect such factors as the exhaustion of major oil fields, growing demand from China and other emerging economies as more people grow rich enough to buy cars, and so on. Can’t we just add up what happens in each of these markets to find out what happens to the overall level of prices?
The answer is no, we can’t. Supply and demand can only explain why a particular good or service becomes more expensive relative to other goods and services. It can’t explain why, for example, the price of chicken has risen over time in spite of the facts that chicken production has become more efficient (you don’t want to know) and that chicken has become substantially cheaper compared to other goods.
What causes the overall level of prices to rise or fall? As we’ll learn in Chapter 12, in the short run, movements in inflation are closely related to the business cycle. When the economy is depressed and jobs are hard to find, inflation tends to fall; when the economy is booming, inflation tends to rise. For example, prices of most goods and services fell sharply during the terrible recession of 1929–1933.
In the long run, by contrast, the overall level of prices is mainly determined by changes in the money supply, the total quantity of assets that can be readily used to make purchases.
The Pain of Inflation and Deflation
Both inflation and deflation can pose problems for the economy. Here are two examples: inflation discourages people from holding onto cash, because cash loses value over time if the overall price level is rising. That is, the amount of goods and services you can buy with a given amount of cash falls. In extreme cases, people stop holding cash altogether and turn to barter. Deflation can cause the reverse problem. If the price level is falling, cash gains value over time. In other words, the amount of goods and sevices you can buy with a given amount of cash increases. So holding on to it can become more attractive than investing in new factories and other productive assets. This can deepen a recession.
The economy has price stability when the overall level of prices changes slowly or not at all.
We’ll describe other costs of inflation and deflation in Chapter 12. For now, let’s just note that, in general, economists regard price stability—in which the overall level of prices is changing, if at all, only slowly—as a desirable goal. Price stability is a goal that seemed far out of reach for much of the post–World War II period but was achieved to most macroeconomists’ satisfaction in the 1990s.
A Fast (Food) Measure of Inflation
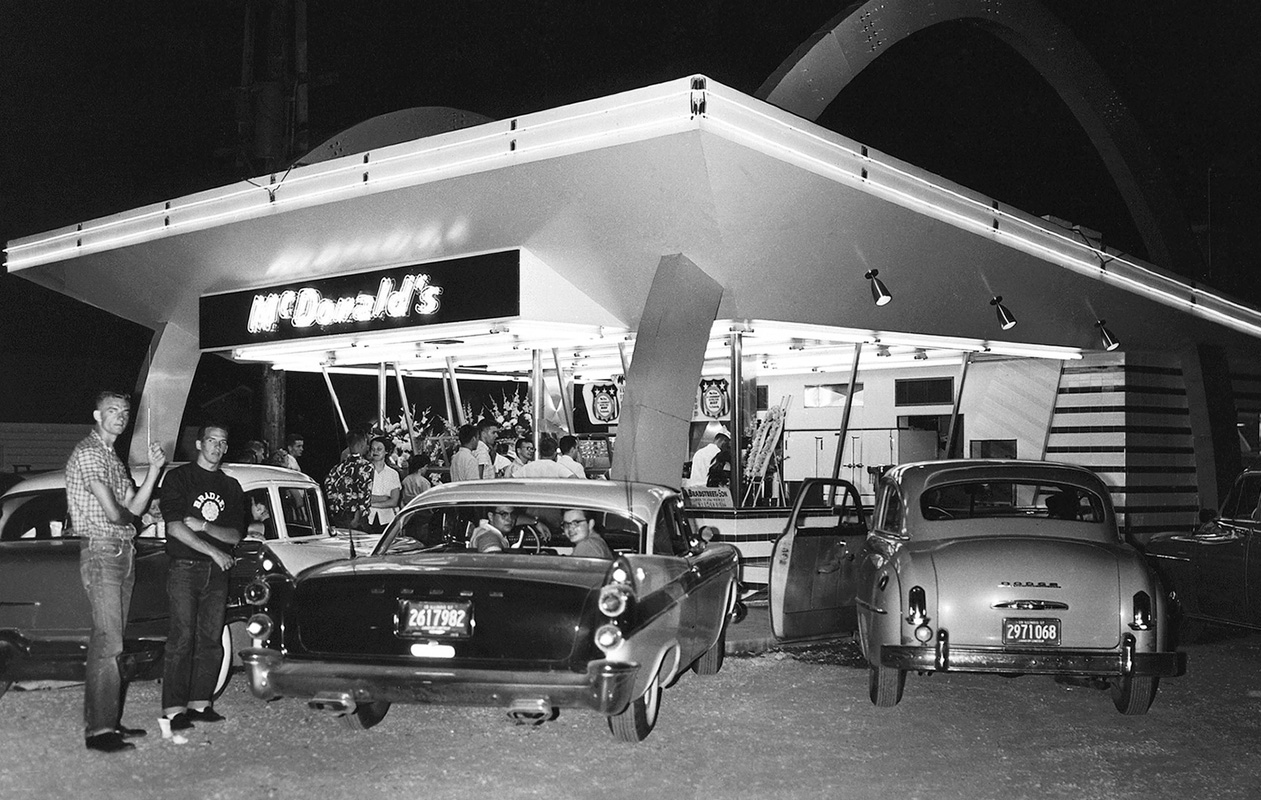
The original McDonald’s opened in 1954. It offered fast service—it was, indeed, the original fast-food restaurant. And it was also very inexpensive: hamburgers cost $0.15, $0.25 with fries. By 2012, a hamburger at a typical McDonald’s cost just over 6 times as much, about $0.95. Has McDonald’s lost touch with its fast-food roots? Have burgers become luxury cuisine?
No—in fact, compared with other consumer goods, a burger is a better bargain today than it was in 1954. Burger prices were about 6.3 times as high in 2012 as they were in 1954. But the consumer price index, the most widely used measure of the cost of living, was 8.5 times as high in 2012 as it was in 1954.
Quick Review
- A dollar today doesn’t buy what it did in 1971, because the prices of most goods have risen. This rise in the overall price level has wiped out most if not all of the wage increases received by the typical American worker over the past 30 years.
- One area of macroeconomic study is in the overall level of prices. Because either inflation or deflation can cause problems for the economy, economists typically advocate maintaining price stability.
Check Your Understanding 10-4
- Which of these sound like inflation, which sound like deflation, and which are ambiguous?
Question
Does the following scenario sound like inflation, deflation, or is it ambiguous?
Gasoline prices are up 10%, food prices are down 20%, and the prices of most services are up 1 to 2%.A. B. C. As some prices have risen but other prices have fallen, there may be overall inflation or deflation. The answer is ambiguous.Question
Does the following scenario sound like inflation, deflation, or is it ambiguous?
Gas prices have doubled, food prices are up 50%, and most services seem to be up 5 or 10%.A. B. C. As all prices have risen significantly, this sounds like inflation.Question
Does the following scenario sound like inflation, deflation, or is it ambiguous?
Gas prices haven’t changed, food prices are way down, and services have gotten cheaper, too.A. B. C. As most prices have fallen and others have not changed, this sounds like deflation.
Solutions appear at back of book.