Problems
- The small economy of Pizzania produces three goods (bread, cheese, and pizza), each produced by a separate company. The bread and cheese companies produce all the inputs they need to make bread and cheese, respectively. The pizza company uses the bread and cheese from the other companies to make its pizzas. All three companies employ labor to help produce their goods, and the difference between the value of goods sold and the sum of labor and input costs is the firm’s profit. The accompanying table summarizes the activities of the three companies when all the bread and cheese produced are sold to the pizza company as inputs in the production of pizzas.
Bread company Cheese company Pizza company Cost of inputs $0 $0 $50 (bread) 35 (cheese) Wages 15 20 75 Value of output 50 35 200 Question
Calculate GDP as the value added in production.
Prob 11 1a. Calculate GDP as the value added in production.Question
Calculate GDP as spending on final goods and services.
Prob 11 1b. Calculate GDP as spending on final goods and services.Question
Calculate GDP as factor income.
Prob 11 1c. Calculate GDP as factor income.
- In the economy of Pizzania (from Problem 1), bread and cheese produced are sold both to the pizza company for inputs in the production of pizzas and to consumers as final goods. The accompanying table summarizes the activities of the three companies.
Bread company Cheese company Pizza company Cost of inputs $0 $0 $50 (bread) 35 (cheese) Wages 25 30 75 Value of output 100 60 200 Question
Calculate GDP as the value added in production.
Prob 11 2a. Calculate GDP as the value added in production.Question
Calculate GDP as spending on final goods and services.
Prob 11 2b. Calculate GDP as spending on final goods and services.Question
Calculate GDP as factor income.
Prob 11 2c. Calculate GDP as factor income.
- Which of the following transactions will be included in GDP for the United States?
Question
Coca-Cola builds a new bottling plant in the United States.
Prob 11 3a. Coca-Cola builds a new bottling plant in the United States.Question
Delta sells one of its existing airplanes to Korean Air.
Prob 11 3b. Delta sells one of its existing airplanes to Korean Air.Question
Ms. Moneybags buys an existing share of Disney stock.
Prob 11 3c. Ms. Moneybags buys an existing share of Disney stock.Question
A California winery produces a bottle of Chardonnay and sells it to a customer in Montreal, Canada.
Prob 11 3d. A California winery produces a bottle of Chardonnay and sells it to a customer in Montreal, Canada.Question
An American buys a bottle of French perfume in Tulsa.
Prob 11 3e. An American buys a bottle of French perfume in Tulsa.Question
A book publisher produces too many copies of a new book; the books don’t sell this year, so the publisher adds the surplus books to inventories.
Prob 11 3f. A book publisher produces too many copies of a new book; the books don’t sell this year, so the publisher adds the surplus books to inventories.
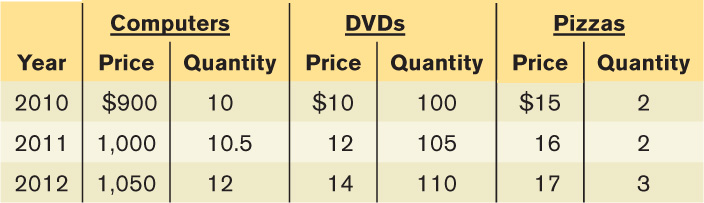
- The economy of Britannica produces three goods: computers, DVDs, and pizza. The accompanying table shows the prices and output of the three goods for the years 2010, 2011, and 2012.
Question
What is the percent change in production of each of the goods from 2010 to 2011 and from 2011 to 2012?
Prob 11 4a. What is the percent change in production of each of the goods from 2010 to 2011 and from 2011 to 2012?Question
What is the percent change in prices of each of the goods from 2010 to 2011 and from 2011 to 2012?
Prob 11 4b. What is the percent change in prices of each of the goods from 2010 to 2011 and from 2011 to 2012?Question
Calculate nominal GDP in Britannica for each of the three years. What is the percent change in nominal GDP from 2010 to 2011 and from 2011 to 2012?
Prob 11 4c. Calculate nominal GDP in Britannica for each of the three years. What is the percent change in nominal GDP from 2010 to 2011 and from 2011 to 2012?Question
Calculate real GDP in Britannica using 2010 prices for each of the three years. What is the percent change in real GDP from 2010 to 2011 and from 2011 to 2012?
Prob 11 4d. Calculate real GDP in Britannica using 2010 prices for each of the three years. What is the percent change in real GDP from 2010 to 2011 and from 2011 to 2012?
- The accompanying table shows data on nominal GDP (in billions of dollars), real GDP (in billions of 2005 dollars), and population (in thousands) of the United States in 1960, 1970, 1980, 1990, 2000, and 2010. The U.S. price level rose consistently over the period 1960–2010.Page 344
Factors That Shift Demand
Year Nominal GDP (billions of dollars) Real GDP (billions of 2005 dollars) Population (thousands) 1960 $526.4 $2,828.5 180,760 1970 1,038.5 4,266.3 205,089 1980 2,788.1 5,834.0 227,726 1990 5,800.5 8,027.1 250,181 2000 9,951.5 11,216.4 282,418 2010 14,526.5 13,088.0 310,106 Table : Factors That Shift DemandQuestion
Why is real GDP greater than nominal GDP for all years until 2000 and lower for 2010?
Prob 11 5a. Why is real GDP greater than nominal GDP for all years until 2000 and lower for 2010?Question
Calculate the percent change in real GDP from 1960 to 1970, 1970 to 1980, 1980 to 1990, 1990 to 2000, and 2000 to 2010. Which period had the highest growth rate?
Prob 11 5b. Calculate the percent change in real GDP from 1960 to 1970, 1970 to 1980, 1980 to 1990, 1990 to 2000, and 2000 to 2010. Which period had the highest growth rate?Question
Calculate real GDP per capita for each of the years in the table.
Prob 11 5c.Calculate real GDP per capita for each of the years in the table.Question
Calculate the percent change in real GDP per capita from 1960 to 1970, 1970 to 1980, 1980 to 1990, 1990 to 2000, and 2000 to 2010. Which period had the highest growth rate?
Prob 11 5d. Calculate the percent change in real GDP per capita from 1960 to 1970, 1970 to 1980, 1980 to 1990, 1990 to 2000, and 2000 to 2010. Which period had the highest growth rate?Question
How do the percent change in real GDP and the percent change in real GDP per capita compare? Which is larger? Do we expect them to have this relationship?
Prob 11 5e. How do the percent change in real GDP and the percent change in real GDP per capita compare? Which is larger? Do we expect them to have this relationship?
- Eastland College is concerned about the rising price of textbooks that students must purchase. To better identify the increase in the price of textbooks, the dean asks you, the Economics Department’s star student, to create an index of textbook prices. The average student purchases three English, two math, and four economics textbooks per year. The prices of these books are given in the accompanying table.
2010 2011 2012 English textbook $50 $55 $57 Math textbook 70 72 74 Economics textbook 80 90 100 Question
What is the percent change in the price of an English textbook from 2010 to 2012?
Prob 11 6a. What is the percent change in the price of an English textbook from 2010 to 2012?Question
What is the percent change in the price of a math textbook from 2010 to 2012?
Prob 11 6b. What is the percent change in the price of a math textbook from 2010 to 2012?Question
What is the percent change in the price of an economics textbook from 2010 to 2012?
Prob 11 6c. What is the percent change in the price of an economics textbook from 2010 to 2012?Question
Using 2010 as a base year, create a price index for these books for all years.
Prob 11 6d. Using 2010 as a base year, create a price index for these books for all years.Question
What is the percent change in the price index from 2010 to 2012?
Prob 11 6e. What is the percent change in the price index from 2010 to 2012?
The consumer price index, or CPI, measures the cost of living for a typical urban household by multiplying the price for each category of expenditure (housing, food, and so on) times a measure of the importance of that expenditure in the average consumer’s market basket and summing over all categories. However, using data from the consumer price index, we can see that changes in the cost of living for different types of consumers can vary a great deal. Let’s compare the cost of living for a hypothetical retired person and a hypothetical college student. Let’s assume that the market basket of a retired person is allocated in the following way: 10% on housing, 15% on food, 5% on transportation, 60% on medical care, 0% on education, and 10% on recreation. The college student’s market basket is allocated as follows: 5% on housing, 15% on food, 20% on transportation, 0% on medical care, 40% on education, and 20% on recreation. The accompanying table shows the September 2012 CPI for each of the relevant categories.
Calculate the overall CPI for the retired person and for the college student by multiplying the CPI for each of the categories by the relative importance of that category to the individual and then summing each of the categories. The CPI for all items in September 2012 was 231.4. How do your calculations for a CPI for the retired person and the college student compare to the overall CPI?CPI September 2012 Housing 223.9 Food 234.2 Transportation 221.7 Medical care 418.0 Education 134.6 Recreation 115.0 Question
Prob 11 7. The consumer price index, or CPI, measures the cost of living for a typical urban household by multiplying the price for each category of expenditure (housing, food, and so on) times a measure of the importance of that expenditure in the average consumer’s market basket and summing over all categories. However, using data from the consumer price index, we can see that changes in the cost of living for different types of consumers can vary a great deal. Let’s compare the cost of living for a hypothetical retired person and a hypothetical college student. Let’s assume that the market basket of a retired person is allocated in the following way: 10% on housing, 15% on food, 5% on transportation, 60% on medical care, 0% on education, and 10% on recreation. The college student’s market basket is allocated as follows: 5% on housing, 15% on food, 20% on transportation, 0% on medical care, 40% on education, and 20% on recreation. The accompanying table shows the September 2012 CPI for each of the relevant categories.Calculate the overall CPI for the retired person and for the college student by multiplying the CPI for each of the categories by the relative importance of that category to the individual and then summing each of the categories. The CPI for all items in September 2012 was 231.4. How do your calculations for a CPI for the retired person and the college student compare to the overall CPI?Question
Each month the Bureau of Labor Statistics releases the Consumer Price Index Summary for the previous month. Go to the Bureau of Labor Statistics home page at www.bls.gov. Place the cursor over the “Economic Releases” tab and then click on “Major Economic Indicators” in the drop-down menu that appears. Once on the “Major Economic Indicators” page, click on “Consumer Price Index.” Use the “not seasonally adjusted” figures. On that page, under “Table of Contents,” click on “Consumer Price Index Summary.” What was the CPI for the previous month? How did it change from the previous month? How does the CPI compare to the same month one year ago?
Prob 11 8. Each month the Bureau of Labor Statistics releases the Consumer Price Index Summary for the previous month. Go to the Bureau of Labor Statistics home page at www.bls.gov. Place the cursor over the “Economic Releases” tab and then click on “Major Economic Indicators” in the drop-down menu that appears. Once on the “Major Economic Indicators” page, click on “Consumer Price Index.” Use the “not seasonally adjusted” figures. On that page, under “Table of Contents,” click on “Consumer Price Index Summary.” What was the CPI for the previous month? How did it change from the previous month? How does the CPI compare to the same month one year ago?- The accompanying table provides the annual real GDP (in billions of 2005 dollars) and nominal GDP (in billions of dollars) for the United States.
2007 2008 2009 2010 2011 Real GDP (billions of 2005 dollars) 13,206.4 13,161.9 12,703.1 13,088.0 13,299.1 Nominal GDP (billions of dollars) 14,028.7 14,291.5 13,939.0 14,526.5 15,075.7 Page 345Question
Calculate the GDP deflator for each year.
Prob 11 9a. Calculate the GDP deflator for each year.Question
Use the GDP deflator to calculate the inflation rate for all years except 2007.
Prob 11 9b. Use the GDP deflator to calculate the inflation rate for all years except 2007.
The accompanying table contains two price indexes for the years 2009, 2010, and 2011: the GDP deflator and the CPI. For each price index, calculate the inflation rate from 2009 to 2010 and from 2010 to 2011.
Year GDP deflator CPI 2009 109.729 214.537 2010 110.992 218.056 2011 113.359 224.939 Question
Prob 11 10. The accompanying table contains two price indexes for the years 2009, 2010, and 2011: the GDP deflator and the CPI. For each price index, calculate the inflation rate from 2009 to 2010 and from 2010 to 2011.
Extend Your Understanding
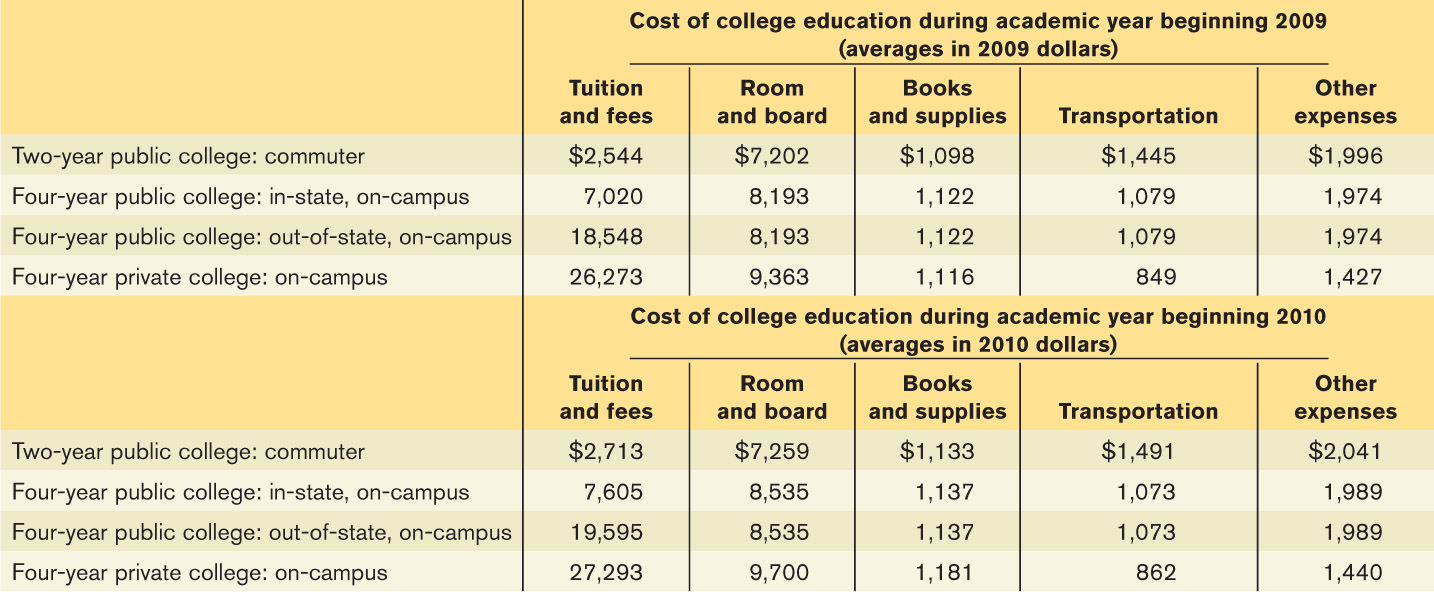
- The cost of a college education in the United States is rising at a rate faster than inflation. The table below shows the average cost of a college education in the United States during the academic year that began in 2009 and the academic year that began in 2010 for public and private colleges. Assume the costs listed in the table are the only costs experienced by the various college students in a single year.
Question
Calculate the cost of living for an average college student in each category for 2009 and 2010.
Prob 11 11a. Calculate the cost of living for an average college student in each category for 2009 and 2010.Question
Calculate an inflation rate for each type of college student between 2009 and 2010.
Prob 11 11b. Calculate an inflation rate for each type of college student between 2009 and 2010.