The Current Population Survey
Every month, the U.S. Census Bureau surveys about 60,000 American households to gather information about the U.S. labor force for the Bureau of Labor Statistics. The survey, known as the Current Population Survey (CPS), provides information about employment, unemployment, earnings, work hours, and more. Once these data are collected, researchers at the Bureau of Labor Statistics publish a number of tables describing their findings. Please complete the table below and analyze the trend in the unemployment rate, the employment-population rate, and the participation rate from September 2011 through September 2012. Then determine whether the unemployment rate in September 2012 is high or low by historical standards.
| Sept. 2011(thousands) | May 2012(thousands) | June 2012(thousands) | July 2012(thousands) | August 2012(thousands) | Sept. 2012(thousands) | |
|---|---|---|---|---|---|---|
| Civilian noninstitutional population | 240,071 | 242,966 | 243,155 | 243,354 | 243,566 | 243,772 |
| Civilian labor force | 154,004 | 155,007 | 155,163 | 155,013 | 154,645 | 155,063 |
| Participation rate | ? | ? | ? | ? | ? | ? |
| Employed | 140,107 | 142,287 | 142,415 | 142,220 | 142,101 | 142,974 |
| Employment-population ratio | ? | ? | ? | ? | ? | ? |
| Unemployed | 13,897 | 12,720 | 12,749 | 12,794 | 12,544 | 12,088 |
| Unemployment rate | ? | ? | ? | ? | ? | ? |
| Not in labor force | 86,067 | 87,959 | 87,992 | 88,341 | 88,921 | 88,709 |
| Persons who currently want a job… | 5,929 | 6,291 | 6,520 | 6,554 | 6,957 | 6,727 |
Complete the table.
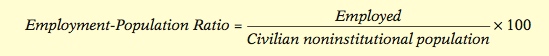
Read the section “Defining and Measuring Unemployment”on pages 348–349. Equations 12-1 and 12-2 demonstrate how to calculate the participation rate and the unemployment rate. The employment-population ratio is calculated as follows:
The completed table is shown below.
| Sept. 2011(thousands) | May 2012(thousands) | June 2012(thousands) | July 2012(thousands) | August 2012(thousands) | Sept. 2012(thousands) | |
|---|---|---|---|---|---|---|
| Civilian noninstitutional population | 240,071 | 242,966 | 243,155 | 243,354 | 243,566 | 243,772 |
| Civilian labor force | 154,004 | 155,007 | 155,163 | 155,013 | 154,645 | 155,063 |
| Participation rate | 64.1% | 63.8% | 63.8% | 63.7% | 63.5% | 63.6% |
| Employed | 140,107 | 142,287 | 142,415 | 142,220 | 142,101 | 142,974 |
| Employment-population ratio | 58.4% | 58.6% | 58.6% | 58.4% | 58.3% | 58.7% |
| Unemployed | 13,897 | 12,720 | 12,749 | 12,794 | 12,544 | 12,088 |
| Unemployment rate | 9.0% | 8.2% | 8.2% | 8.3% | 8.1% | 7.8% |
| Not in labor force | 86,067 | 87,959 | 87,992 | 88,341 | 88,921 | 88,709 |
| Persons who currently want a job… | 5,929 | 6,291 | 6,520 | 6,554 | 6,957 | 6,727 |
As shown in Equation 12-1 on page 349, the participation rate is calculated by dividing the civilian labor force by the civilian noninstitutional population and then multiplying by 100. The September 2011 participation rate is therefore 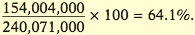 As shown in Equation 12-2 on page 349, the unemployment rate is calculated by dividing the unemployed by the civilian labor force and then multiplying by 100. The September 2011 unemployment rate is therefore
 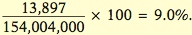 The employment-population ratio is calculated by dividing the employed by the civilian noninstitutional population and then multiplying by 100. The September 2011 employment-population ratio is therefore
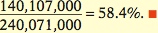
Analyze the trend in the unemployment rate, the employment-population rate, and the participation rate from September 2011 through September 2012. Is the unemployment rate in September 2012 high or low by historical standards?
Read the section “The Significance of the Unemployment Rate” beginning on page 349, and study Figure 12-1 on page 348.
The unemployment rate is broadly decreasing over this period. Both the participation rate and the employment-population ratio are decreasing as well. By historical standards, as indicated in Figure 12-1, an unemployment rate of 7.8% is high. 