Problems
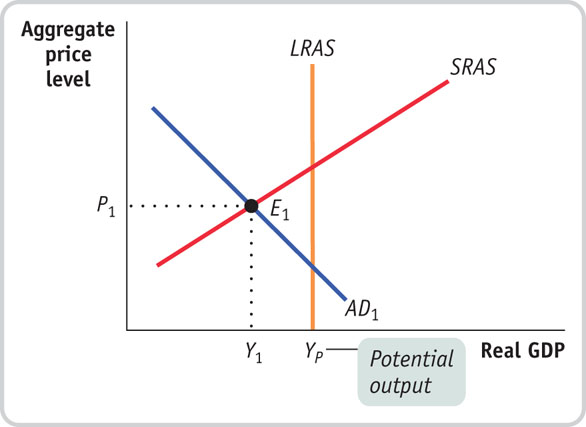
- The accompanying diagram shows the current macroeconomic situation for the economy of Albernia. You have been hired as an economic consultant to help the economy move to potential output, YP.
Question
Is Albernia facing a recessionary or inflationary gap?
Prob 15 1a. Is Albernia facing a recessionary or inflationary gap?Question
Which type of fiscal policy—expansionary or contractionary—would move the economy of Albernia to potential output, YP? What are some examples of such policies?
Prob 15 1b. Which type of fiscal policy—expansionary or contractionary—would move the economy of Albernia to potential output, YP? What are some examples of such policies?Question
Illustrate the macroeconomic situation in Albernia with a diagram after the successful fiscal policy has been implemented.
Prob 15 1c. Illustrate the macroeconomic situation in Albernia with a diagram after the successful fiscal policy has been implemented.
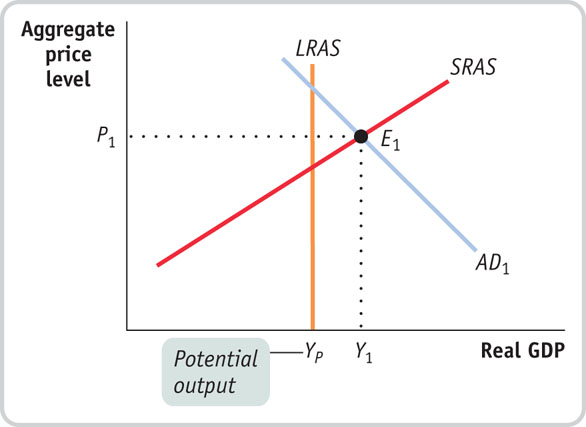
- The accompanying diagram shows the current macroeconomic situation for the economy of Brittania; real GDP is Y1, and the aggregate price level is P1. You have been hired as an economic consultant to help the economy move to potential output, YP.
Question
Is Brittania facing a recessionary or inflationary gap?
Prob 15 2a. Is Brittania facing a recessionary or inflationary gap?Question
Which type of fiscal policy—expansionary or contractionary—would move the economy of Brittania to potential output, YP? What are some examples of such policies?
Prob 15 2b. Which type of fiscal policy—expansionary or contractionary—would move the economy of Brittania to potential output, YP? What are some examples of such policies?Question
Illustrate the macroeconomic situation in Brittania with a diagram after the successful fiscal policy has been implemented.
Prob 15 2c. Illustrate the macroeconomic situation in Brittania with a diagram after the successful fiscal policy has been implemented.
- An economy is in long-run macroeconomic equilibrium when each of the following aggregate demand shocks occurs. What kind of gap—inflationary or recessionary—will the economy face after the shock, and what type of fiscal policies would help move the economy back to potential output? How would your recommended fiscal policy shift the aggregate demand curve?
Question
A stock market boom increases the value of stocks held by households.
Prob 15 3a. A stock market boom increases the value of stocks held by households.Question
Firms come to believe that a recession in the near future is likely.
Prob 15 3b. Firms come to believe that a recession in the near future is likely.Question
Anticipating the possibility of war, the government increases its purchases of military equipment.
Prob 15 3c.Anticipating the possibility of war, the government increases its purchases of military equipment.Question
The quantity of money in the economy declines and interest rates increase.
Prob 15 3d. The quantity of money in the economy declines and interest rates increase.
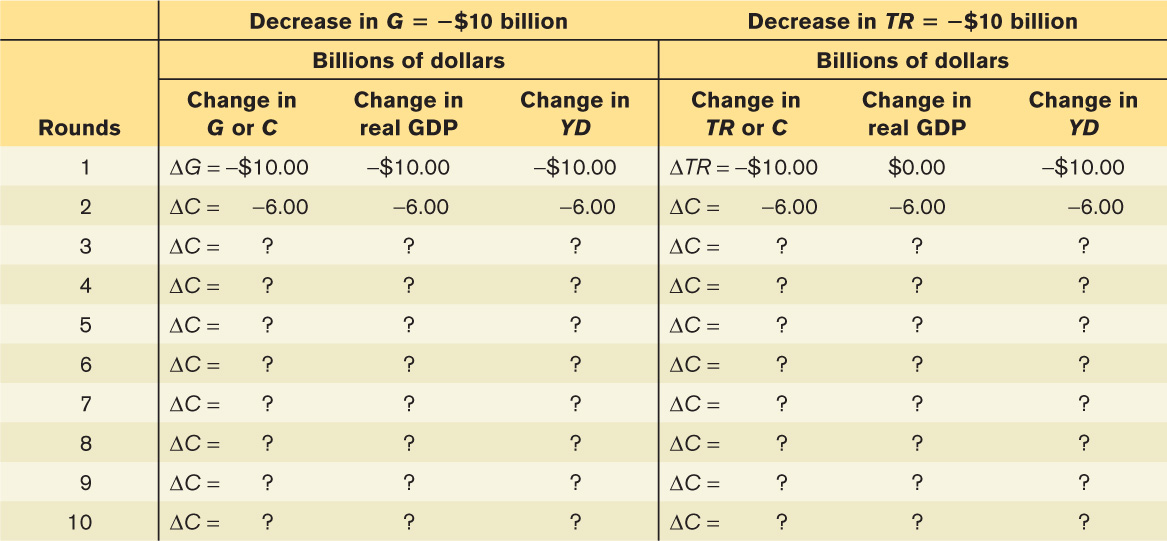
- Show why a $10 billion reduction in government purchases of goods and services will have a larger effect on real GDP than a $10 billion reduction in government transfers by completing the accompanying table for an economy with a marginal propensity to consume (MPC) of 0.6. The first and second rows of the table are filled in for you: on the left side of the table, in the first row, the $10 billion reduction in government purchases decreases real GDP and disposable income, YD, by $10 billion, leading to a reduction in consumer spending of $6 billion (MPC × change in disposable income) in row 2. However, on the right side of the table, the $10 billion reduction in transfers has no effect on real GDP in round 1 but does lower YD by $10 billion, resulting in a decrease in consumer spending of $6 billion in round 2.
Question
When government purchases decrease by $10 billion, what is the sum of the changes in real GDP after the 10 rounds?
Prob 15 4a. When government purchases decrease by $10 billion, what is the sum of the changes in real GDP after the 10 rounds?Question
When the government reduces transfers by $10 billion, what is the sum of the changes in real GDP after the 10 rounds?
Prob 15 4b. When the government reduces transfers by $10 billion, what is the sum of the changes in real GDP after the 10 rounds?Question
Using the formula for the multiplier for changes in government purchases and for changes in transfers, calculate the total change in real GDP due to the $10 billion decrease in government purchases and the $10 billion reduction in transfers. What explains the difference? (Hint: The multiplier for government purchases of goods and services is 1/(1 − MPC). But since each $1 change in government transfers only leads to an initial change in real GDP of MPC × $1, the multiplier for government transfers is MPC/(1 − MPC).)
Prob 15 4c. Using the formula for the multiplier for changes in government purchases and for changes in transfers, calculate the total change in real GDP due to the $10 billion decrease in government purchases and the $10 billion reduction in transfers. What explains the difference? (Hint: The multiplier for government purchases of goods and services is 1/(1 − MPC). But since each $1 change in government transfers only leads to an initial change in real GDP of MPC × $1, the multiplier for government transfers is MPC/(1 − MPC).)
- In each of the following cases, either a recessionary or inflationary gap exists. Assume that the aggregate supply curve is horizontal, so that the change in real GDP arising from a shift of the aggregate demand curve equals the size of the shift of the curve. Calculate both the change in government purchases of goods and services and the change in government transfers necessary to close the gap.
Question
Real GDP equals $100 billion, potential output equals $160 billion, and the marginal propensity to consume is 0.75.
Prob 15 5a. Real GDP equals $100 billion, potential output equals $160 billion, and the marginal propensity to consume is 0.75.Question
Real GDP equals $250 billion, potential output equals $200 billion, and the marginal propensity to consume is 0.5.
Prob 15 5b. Real GDP equals $250 billion, potential output equals $200 billion, and the marginal propensity to consume is 0.5.Question
Real GDP equals $180 billion, potential output equals $100 billion, and the marginal propensity to consume is 0.8.
Prob 15 5c. Real GDP equals $180 billion, potential output equals $100 billion, and the marginal propensity to consume is 0.8.
Question
Most macroeconomists believe it is a good thing that taxes act as automatic stabilizers and lower the size of the multiplier. However, a smaller multiplier means that the change in government purchases of goods and services, government transfers, or taxes needed to close an inflationary or recessionary gap is larger. How can you explain this apparent inconsistency?
Prob 15 6. Most macroeconomists believe it is a good thing that taxes act as automatic stabilizers and lower the size of the multiplier. However, a smaller multiplier means that the change in government purchases of goods and services, government transfers, or taxes needed to close an inflationary or recessionary gap is larger. How can you explain this apparent inconsistency?- The accompanying table shows how consumers’ marginal propensities to consume in a particular economy are related to their level of income.
Income range Marginal propensity to consume $0-$20,000 0.9 $20,001-$40,000 0.8 $40,001-$60,000 0.7 $60,001-$80,000 0.6 Above $80,000 0.5 Question
Suppose the government engages in increased purchases of goods and services. For each of the income groups in the table, what is the value of the multiplier—that is, what is the “bang for the buck” from each dollar the government spends on government purchases of goods and services in each income group?
Prob 15 7a. Suppose the government engages in increased purchases of goods and services. For each of the income groups in the table, what is the value of the multiplier—that is, what is the “bang for the buck” from each dollar the government spends on government purchases of goods and services in each income group?Question
If the government needed to close a recessionary or inflationary gap, at which group should it primarily aim its fiscal policy of changes in government purchases of goods and services?
Prob 15 7b. If the government needed to close a recessionary or inflationary gap, at which group should it primarily aim its fiscal policy of changes in government purchases of goods and services?
Question
The government’s budget surplus in Macroland has risen consistently over the past five years. Two government policy makers disagree as to why this has happened. One argues that a rising budget surplus indicates a growing economy; the other argues that it shows that the government is using contractionary fiscal policy. Can you determine which policy maker is correct? If not, why not?
Prob 15 8. The government’s budget surplus in Macroland has risen consistently over the past five years. Two government policy makers disagree as to why this has happened. One argues that a rising budget surplus indicates a growing economy; the other argues that it shows that the government is using contractionary fiscal policy. Can you determine which policy maker is correct? If not, why not?Question
Figure 15-9 shows the actual budget deficit and the cyclically adjusted budget deficit as a percentage of GDP in the United States from 1970 to 2011. Assuming that potential output was unchanged, use this figure to determine which of the years from 1990 to 2009 the government used expansionary fiscal policy and in which years it used contractionary fiscal policy.
Prob 15 9. Figure 15-9 shows the actual budget deficit and the cyclically adjusted budget deficit as a percentage of GDP in the United States from 1970 to 2011. Assuming that potential output was unchanged, use this figure to determine which of the years from 1990 to 2009 the government used expansionary fiscal policy and in which years it used contractionary fiscal policy.Question
You are an economic adviser to a candidate for national office. She asks you for a summary of the economic consequences of a balanced-budget rule for the federal government and for your recommendation on whether she should support such a rule. How do you respond?
Prob 15 10. You are an economic adviser to a candidate for national office. She asks you for a summary of the economic consequences of a balanced-budget rule for the federal government and for your recommendation on whether she should support such a rule. How do you respond?Question
Your study partner argues that the distinction between the government’s budget deficit and debt is similar to the distinction between consumer savings and wealth. He also argues that if you have large budget deficits, you must have a large debt. In what ways is your study partner correct and in what ways is he incorrect?
Prob 15 11. Your study partner argues that the distinction between the government’s budget deficit and debt is similar to the distinction between consumer savings and wealth. He also argues that if you have large budget deficits, you must have a large debt. In what ways is your study partner correct and in what ways is he incorrect?- In which of the following cases does the size of the government’s debt and the size of the budget deficit indicate potential problems for the economy?
Question
The government’s debt is relatively low, but the government is running a large budget deficit as it builds a high-speed rail system to connect the major cities of the nation.
Prob 15 12a. The government’s debt is relatively low, but the government is running a large budget deficit as it builds a high-speed rail system to connect the major cities of the nation.Question
The government’s debt is relatively high due to a recently ended deficit-financed war, but the government is now running only a small budget deficit.
Prob 15 12b. The government’s debt is relatively high due to a recently ended deficit-financed war, but the government is now running only a small budget deficit.Question
The government’s debt is relatively low, but the government is running a budget deficit to finance the interest payments on the debt.
Prob 15 12c. The government’s debt is relatively low, but the government is running a budget deficit to finance the interest payments on the debt.
- How did or would the following affect the current public debt and implicit liabilities of the U.S. government?
Question
In 2003, Congress passed and President Bush signed the Medicare Modernization Act, which provides seniors and individuals with disabilities with a prescription drug benefit. Some of the benefits under this law took effect immediately, but others will not begin until sometime in the future.
Prob 15 13a. In 2003, Congress passed and President Bush signed the Medicare Modernization Act, which provides seniors and individuals with disabilities with a prescription drug benefit. Some of the benefits under this law took effect immediately, but others will not begin until sometime in the future.Question
The age at which retired persons can receive full Social Security benefits is raised to age 70 for future retirees.
Prob 15 13b. The age at which retired persons can receive full Social Security benefits is raised to age 70 for future retirees.Question
Social Security benefits for future retirees are limited to those with low incomes.
Prob 15 13c. Social Security benefits for future retirees are limited to those with low incomes.Question
Because the cost of health care is increasing faster than the overall inflation rate, annual increases in Social Security benefits are increased by the annual increase in health care costs rather than the overall inflation rate.
Prob 15 13d. Because the cost of health care is increasing faster than the overall inflation rate, annual increases in Social Security benefits are increased by the annual increase in health care costs rather than the overall inflation rate.
Extend Your Understanding
- In 2012, the policy makers of the economy of Eastlandia projected the debt–GDP ratio and the ratio of the budget deficit to GDP for the economy for the next 10 years under different scenarios for growth in the government’s deficit. Real GDP is currently $1,000 billion per year and is expected to grow by 3% per year, the public debt is $300 billion at the beginning of the year, and the deficit is $30 billion in 2012.Page 479
Year Real GDP (billions of dollars) Debt (billions) of dollars) Budget deficit (billions of dollars) Debt (percent of real GDP) Budget deficit (percent of real GDP) 2012 $1,000 $300 $30 ? ? 2013 1,030 ? ? ? ? 2014 1,061 ? ? ? ? 2015 1,093 ? ? ? ? 2016 1,126 ? ? ? ? 2017 1,159 ? ? ? ? 2018 1,194 ? ? ? ? 2019 1,230 ? ? ? ? 2020 1,267 ? ? ? ? 2021 1,305 ? ? ? ? 2022 1,344 ? ? ? ? Question
Complete the accompanying table to show the debt–GDP ratio and the ratio of the budget deficit to GDP for the economy if the government’s budget deficit remains constant at $30 billion over the next 10 years. (Remember that the government’s debt will grow by the previous year’s deficit.)
Prob 15 14a. Complete the accompanying table to show the debt–GDP ratio and the ratio of the budget deficit to GDP for the economy if the government’s budget deficit remains constant at $30 billion over the next 10 years. (Remember that the government’s debt will grow by the previous year’s deficit.)Question
Redo the table to show the debt–GDP ratio and the ratio of the budget deficit to GDP for the economy if the government’s budget deficit grows by 3% per year over the next 10 years.
Prob 15 14b. Redo the table to show the debt–GDP ratio and the ratio of the budget deficit to GDP for the economy if the government’s budget deficit grows by 3% per year over the next 10 years.Question
Redo the table again to show the debt–GDP ratio and the ratio of the budget deficit to GDP for the economy if the government’s budget deficit grows by 20% per year over the next 10 years.
Prob 15 14c. Redo the table again to show the debt–GDP ratio and the ratio of the budget deficit to GDP for the economy if the government’s budget deficit grows by 20% per year over the next 10 years.Question
What happens to the debt–GDP ratio and the ratio of the budget deficit to GDP for the economy over time under the three different scenarios?
Prob 15 14d. What happens to the debt–GDP ratio and the ratio of the budget deficit to GDP for the economy over time under the three different scenarios?
- Unlike households, governments are often able to sustain large debts. For example, in 2011, the U.S. government’s total debt reached $14.8 trillion, approximately equal to 102.7% of GDP. At the time, according to the U.S. Treasury, the average interest rate paid by the government on its debt was 2.2%. However, running budget deficits becomes hard when very large debts are outstanding.
Question
Calculate the dollar cost of the annual interest on the government’s total debt assuming the interest rate and debt figures cited above.
Prob 15 15a. Calculate the dollar cost of the annual interest on the government’s total debt assuming the interest rate and debt figures cited above.Question
If the government operates on a balanced budget before interest payments are taken into account, at what rate must GDP grow in order for the debt–GDP ratio to remain unchanged?
Prob 15 15b. If the government operates on a balanced budget before interest payments are taken into account, at what rate must GDP grow in order for the debt–GDP ratio to remain unchanged?Question
Calculate the total increase in national debt if the government incurs a deficit of $600 billion in 2012.
Prob 15 15c. Calculate the total increase in national debt if the government incurs a deficit of $600 billion in 2012.Question
At what rate would GDP have to grow in order for the debt–GDP ratio to remain unchanged when the deficit in 2012 is $600 billion?
Prob 15 15d. At what rate would GDP have to grow in order for the debt–GDP ratio to remain unchanged when the deficit in 2012 is $600 billion?Question
Why is the debt–GDP ratio the preferred measure of a country’s debt rather than the dollar value of the debt? Why is it important for a government to keep this number under control?
Prob 15 15e. Why is the debt–GDP ratio the preferred measure of a country’s debt rather than the dollar value of the debt? Why is it important for a government to keep this number under control?
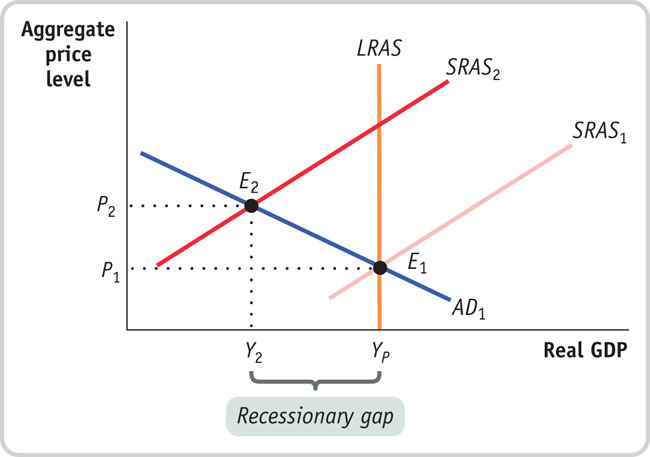
- During an interview in 2008, the German Finance Minister Peer Steinbrueck said, “We have to watch out that in Europe and beyond, nothing like a combination of downward economic [growth] and high inflation rates emerges—something that experts call stagflation.” Such a situation can be depicted by the movement of the short-run aggregate supply curve from its original position, SRAS1, to its new position, SRAS2, with the new equilibrium point E2 in the accompanying figure. In this question, we try to understand why stagflation is particularly hard to fix using fiscal policy.
Question
What would be the appropriate fiscal policy response to this situation if the primary concern of the government was to maintain economic growth? Illustrate the effect of the policy on the equilibrium point and the aggregate price level using the diagram.
Prob 15 16a. What would be the appropriate fiscal policy response to this situation if the primary concern of the government was to maintain economic growth? Illustrate the effect of the policy on the equilibrium point and the aggregate price level using the diagram.Question
What would be the appropriate fiscal policy response to this situation if the primary concern of the government was to maintain price stability? Illustrate the effect of the policy on the equilibrium point and the aggregate price level using the diagram.
Prob 15 16b. What would be the appropriate fiscal policy response to this situation if the primary concern of the government was to maintain price stability? Illustrate the effect of the policy on the equilibrium point and the aggregate price level using the diagram.Question
Discuss the effectiveness of the policies in parts a and b in fighting stagflation.
Prob 15 16c. Discuss the effectiveness of the policies in parts a and b in fighting stagflation.