Comparative Advantage and International Trade
Goods and services purchased from other countries are imports; goods and services sold to other countries are exports.
The United States buys auto parts—and many other goods and services—from other countries. At the same time, it sells many goods and services to other countries. Goods and services purchased from abroad are imports; goods and services sold abroad are exports.
As illustrated by the opening story, imports and exports have taken on an increasingly important role in the U.S. economy. Over the last 50 years, both imports into and exports from the United States have grown faster than the U.S. economy. Panel (a) of Figure 19-1 shows how the values of U.S. imports and exports have grown as a percentage of gross domestic product (GDP). Panel (b) shows imports and exports as a percentage of GDP for a number of countries. It shows that foreign trade is significantly more important for many other countries than it is for the United States. (Japan is the exception.)
FIGURE 19-1 The Growing Importance of International Trade

Globalization is the phenomenon of growing economic linkages among countries.
Foreign trade isn’t the only way countries interact economically. In the modern world, investors from one country often invest funds in another nation; many companies are multinational, with subsidiaries operating in several countries; and a growing number of individuals work in a country different from the one in which they were born. The growth of all these forms of economic linkages among countries is often called globalization.
We begin by focusing mainly on international trade. To understand why international trade occurs and why economists believe it is beneficial to the economy, we will first review the concept of comparative advantage.
Production Possibilities and Comparative Advantage, Revisited
To produce auto parts, any country must use resources—land, labor, capital, and so on—that could have been used to produce other things. The potential production of other goods a country must forgo to produce an auto part is the opportunity cost of that part.
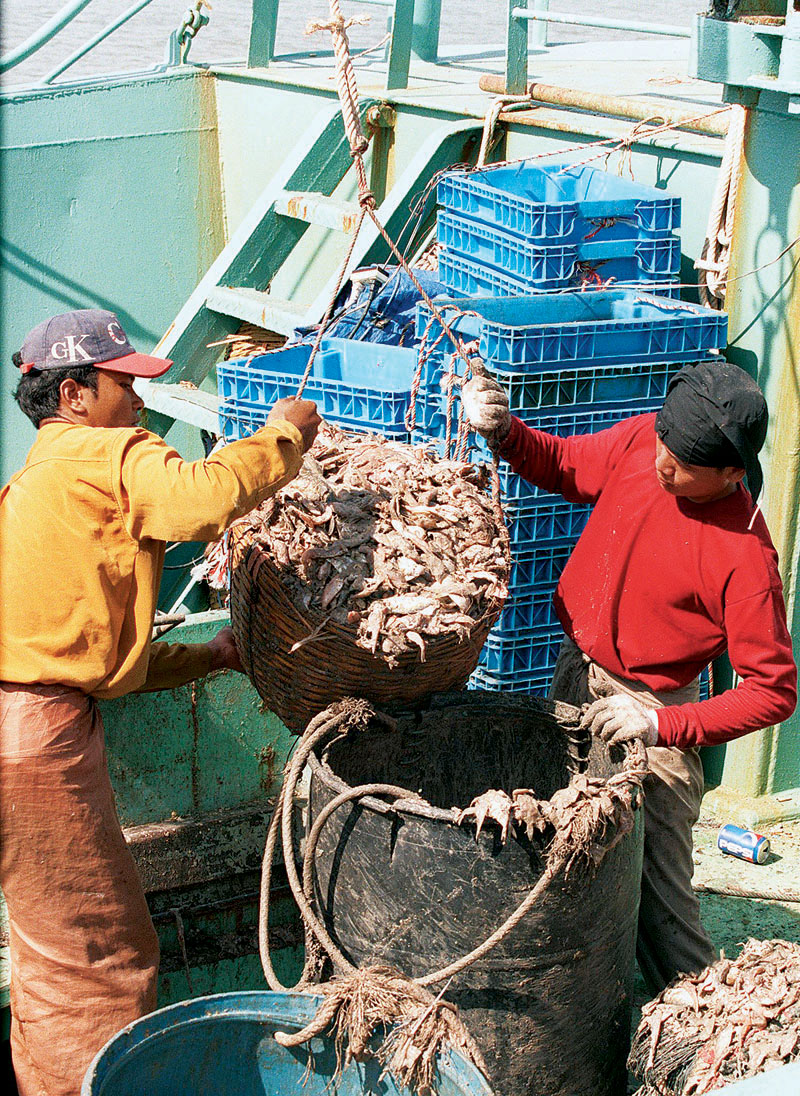
In some cases, it’s easy to see why the opportunity cost of producing a good is especially low in a given country. Consider, for example, shrimp—much of which now comes from seafood farms in Vietnam and Thailand. It’s a lot easier to produce shrimp in Vietnam, where the climate is nearly ideal and there’s plenty of coastal land suitable for shellfish farming, than it is in the United States. Conversely, other goods are not produced as easily in Vietnam as in the United States. For example, Vietnam doesn’t have the base of skilled workers and technological know-how that makes the United States so good at producing high-technology goods. So the opportunity cost of a ton of shrimp, in terms of other goods such as aircraft, is much less in Vietnam than it is in the United States.
In other cases, matters are a bit less obvious. It’s as easy to produce auto parts in the United States as it is in Mexico, and Mexican auto parts workers are, if anything, less efficient than their U.S. counterparts. But Mexican workers are a lot less productive than U.S. workers in other areas, such as aircraft and chemical production. This means that diverting a Mexican worker into auto parts production reduces output of other goods less than diverting a U.S. worker into auto parts production. That is, the opportunity cost of producing auto parts in Mexico is less than it is in the United States.
So we say that Mexico has a comparative advantage in producing auto parts. Let’s repeat the definition of comparative advantage from Chapter 2: A country has a comparative advantage in producing a good or service if the opportunity cost of producing the good or service is lower for that country than for other countries.
Figure 19-2 provides a hypothetical numerical example of comparative advantage in international trade. We assume that only two goods are produced and consumed, auto parts and airplanes, and that there are only two countries in the world, the United States and Mexico. (In real life, auto parts aren’t worth much without auto bodies to put them in, but let’s set that issue aside.) The figure shows hypothetical production possibility frontiers for the United States and Mexico.
FIGURE 19-2 Comparative Advantage and the Production Possibility Frontier

The Ricardian model of international trade analyzes international trade under the assumption that opportunity costs are constant.
As in Chapter 2, we simplify the model by assuming that the production possibility frontiers are straight lines, as shown in Figure 2-1, rather than the more realistic bowed-out shape shown in Figure 2-2. The straight-line shape implies that the opportunity cost of an auto part in terms of airplanes in each country is constant—it does not depend on how many units of each good the country produces. The analysis of international trade under the assumption that opportunity costs are constant, which makes production possibility frontiers straight lines, is known as the Ricardian model of international trade, named after the English economist David Ricardo, who introduced this analysis in the early nineteenth century.
In Figure 19-2 we have grouped auto parts into bundles of 10,000, so, for example, a country that produces 500 bundles of auto parts is producing 5 million individual auto parts. You can see in the figure that the United States can produce 2,000 airplanes if it produces no auto parts, or 1,000 bundles of auto parts if it produces no airplanes. Thus, the slope of the U.S. production possibility frontier, or PPF, is −2,000/1,000 = −2. That is, to produce an additional bundle of auto parts, the United States must forgo the production of 2 airplanes.
Similarly, Mexico can produce 1,000 airplanes if it produces no auto parts or 2,000 bundles of auto parts if it produces no airplanes. Thus, the slope of Mexico’s PPF is −1,000/2,000 = −1/2. That is, to produce an additional bundle of auto parts, Mexico must forgo the production of 1/2 an airplane.
Autarky is a situation in which a country does not trade with other countries.
Economists use the term autarky to refer to a situation in which a country does not trade with other countries. We assume that in autarky the United States chooses to produce and consume 500 bundles of auto parts and 1,000 airplanes. We also assume that in autarky Mexico produces 1,000 bundles of auto parts and 500 airplanes.
The trade-offs facing the two countries when they don’t trade are summarized in Table 19-1. As you can see, the United States has a comparative advantage in the production of airplanes because it has a lower opportunity cost in terms of auto parts than Mexico has: producing an airplane costs the United States only ½ a bundle of auto parts, while it costs Mexico 2 bundles of auto parts. Correspondingly, Mexico has a comparative advantage in auto parts production: 1 bundle costs it only ½ an airplane, while it costs the United States 2 airplanes.
TABLE 19-1 U.S. and Mexican Opportunity Costs of Auto Parts and Airplanes
| U.S. Opportunity Cost | Mexican Opportunity Cost | ||
|---|---|---|---|
| 1 bundle of auto parts | 2 airplanes | > | 1/2 airplane |
| 1 airplane | 1/2 bundle of auto parts | < | 2 bundles of auto parts |
As we learned in Chapter 2, each country can do better by engaging in trade than it could by not trading. A country can accomplish this by specializing in the production of the good in which it has a comparative advantage and exporting that good, while importing the good in which it has a comparative disadvantage. Let’s see how this works.
The Gains from International Trade
Figure 19-3 illustrates how both countries can gain from specialization and trade, by showing a hypothetical rearrangement of production and consumption that allows each country to consume more of both goods. Again, panel (a) represents the United States and panel (b) represents Mexico. In each panel we indicate again the autarky production and consumption assumed in Figure 19-2. Once trade becomes possible, however, everything changes. With trade, each country can move to producing only the good in which it has a comparative advantage—airplanes for the United States and auto parts for Mexico. Because the world production of both goods is now higher than in autarky, trade makes it possible for each country to consume more of both goods.
FIGURE 19-3 The Gains from International Trade

Table 19-2 sums up the changes as a result of trade and shows why both countries can gain. The left part of the table shows the autarky situation, before trade, in which each country must produce the goods it consumes. The right part of the table shows what happens as a result of trade. After trade, the United States specializes in the production of airplanes, producing 2,000 airplanes and no auto parts; Mexico specializes in the production of auto parts, producing 2,000 bundles of auto parts and no airplanes.
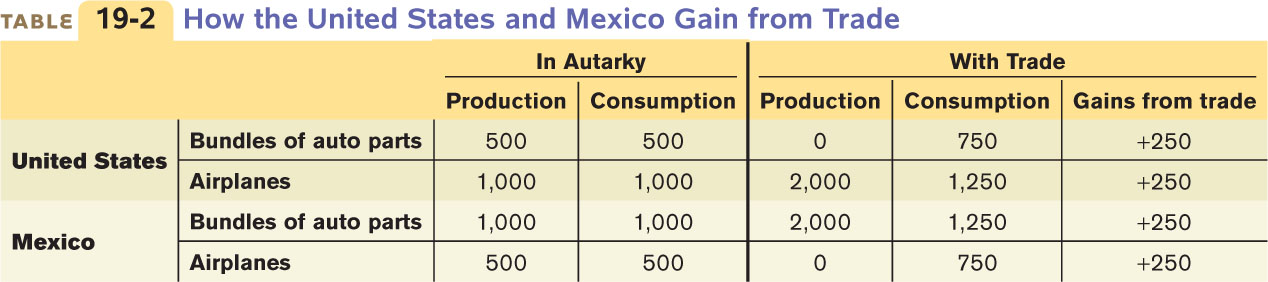
The result is a rise in total world production of both goods. As you can see in the Table 19-2 column at far right showing consumption with trade, the United States is able to consume both more airplanes and more auto parts than before, even though it no longer produces auto parts, because it can import parts from Mexico. Mexico can also consume more of both goods, even though it no longer produces airplanes, because it can import airplanes from the United States.
The key to this mutual gain is the fact that trade liberates both countries from self-sufficiency—from the need to produce the same mixes of goods they consume. Because each country can concentrate on producing the good in which it has a comparative advantage, total world production rises, making a higher standard of living possible in both nations.
Now, in this example we have simply assumed the post-trade consumption bundles of the two countries. In fact, the consumption choices of a country reflect both the preferences of its residents and the relative prices—the prices of one good in terms of another in international markets. Although we have not explicitly given the price of airplanes in terms of auto parts, that price is implicit in our example: Mexico sells the United States the 750 bundles of auto parts the U.S. consumes in return for the 750 airplanes Mexico consumes, so 1 bundle of parts is traded for 1 airplane. This tells us that the price of an airplane on world markets must be equal to the price of one bundle of 10,000 auto parts in our example.
One requirement that the relative price must satisfy is that no country pays a relative price greater than its opportunity cost of obtaining the good in autarky. That is, the United States won’t pay more than 2 airplanes for each 1 bundle of 10,000 auto parts from Mexico, and Mexico won’t pay more than 2 bundles of 10,000 auto parts for each 1 airplane from the United States. Once this requirement is satisfied, the actual relative price in international trade is determined by supply and demand—and we’ll turn to supply and demand in international trade in the next section. However, first let’s look more deeply into the nature of the gains from trade.
Comparative Advantage versus Absolute Advantage
It’s easy to accept the idea that Vietnam and Thailand have a comparative advantage in shrimp production: they have a tropical climate that’s better suited to shrimp farming than that of the United States (even along the Gulf Coast), and they have a lot of usable coastal area. So the United States imports shrimp from Vietnam and Thailand. In other cases, however, it may be harder to understand why we import certain goods from abroad.
U.S. imports of auto parts from Mexico is a case in point. There’s nothing about Mexico’s climate or resources that makes it especially good at manufacturing auto parts. In fact, it almost surely takes fewer hours of labor to produce an auto seat or wiring harness in the United States than in Mexico.
Why, then, do we buy Mexican auto parts? Because the gains from trade depend on comparative advantage, not absolute advantage. Yes, it takes less labor to produce a wiring harness in the United States than in Mexico. That is, the productivity of Mexican auto parts workers is less than that of their U.S. counterparts. But what determines comparative advantage is not the amount of resources used to produce a good but the opportunity cost of that good—here, the quantity of other goods forgone in order to produce an auto seat. And the opportunity cost of auto parts is lower in Mexico than in the United States.
Here’s how it works: Mexican workers have low productivity compared with U.S. workers in the auto parts industry. But Mexican workers have even lower productivity compared with U.S. workers in other industries. Because Mexican labor productivity in industries other than auto parts is relatively very low, producing a wiring harness in Mexico, even though it takes a lot of labor, does not require forgoing the production of large quantities of other goods.
In the United States, the opposite is true: very high productivity in other industries (such as high-technology goods) means that producing an auto seat in the United States, even though it doesn’t require much labor, requires sacrificing lots of other goods. So the opportunity cost of producing auto parts is less in Mexico than in the United States. Despite its lower labor productivity, Mexico has a comparative advantage in the production of many auto parts, although the United States has an absolute advantage.
Mexico’s comparative advantage in auto parts is reflected in global markets by the wages Mexican workers are paid. That’s because a country’s wage rates, in general, reflect its labor productivity. In countries where labor is highly productive in many industries, employers are willing to pay high wages to attract workers, so competition among employers leads to an overall high wage rate. In countries where labor is less productive, competition for workers is less intense and wage rates are correspondingly lower.
As the accompanying Global Comparison shows, there is indeed a strong relationship between overall levels of productivity and wage rates around the world. Because Mexico has generally low productivity, it has a relatively low wage rate. Low wages, in turn, give Mexico a cost advantage in producing goods where its productivity is only moderately low, like auto parts. As a result, it’s cheaper to produce these parts in Mexico than in the United States.
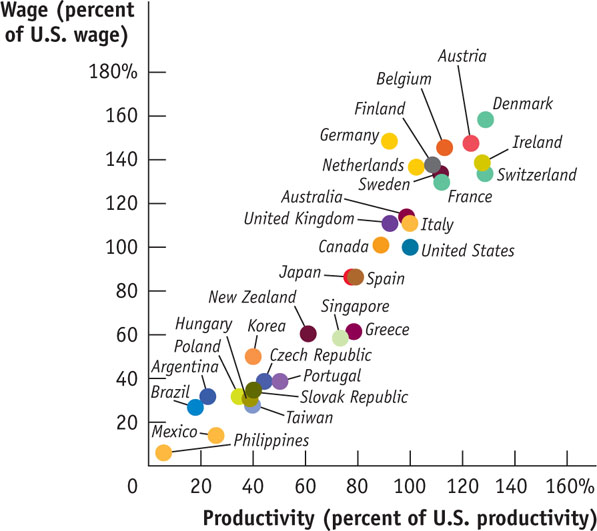
Productivity and Wages Around the World
Is it true that both the pauper labor argument and the sweatshop labor argument are fallacies? Yes, it is. The real explanation for low wages in poor countries is low overall productivity.
The graph shows estimates of labor productivity, measured by the value of output (GDP) per worker, and wages, measured by the monthly compensation of the average worker, for several countries in 2009. Both productivity and wages are expressed as percentages of U.S. productivity and wages; for example, productivity and wages in Japan were 79% and 91%, respectively, of their U.S. levels. You can see the strong positive relationship between productivity and wages. The relationship isn’t perfect. For example, Germany has higher wages than its productivity might lead you to expect. But simple comparisons of wages give a misleading sense of labor costs in poor countries: their low-wage advantage is mostly offset by low productivity.
The kind of trade that takes place between low-wage, low-productivity economies like Mexico and high-wage, high-productivity economies like the United States gives rise to two common misperceptions. One, the pauper labor fallacy, is the belief that when a country with high wages imports goods produced by workers who are paid low wages, this must hurt the standard of living of workers in the importing country. The other, the sweatshop labor fallacy, is the belief that trade must be bad for workers in poor exporting countries because those workers are paid very low wages by our standards.
Both fallacies miss the nature of gains from trade: it’s to the advantage of both countries if the poorer, lower-wage country exports goods in which it has a comparative advantage, even if its cost advantage in these goods depends on low wages. That is, both countries are able to achieve a higher standard of living through trade.
It’s particularly important to understand that buying a good made by someone who is paid much lower wages than most U.S. workers doesn’t necessarily imply that you’re taking advantage of that person. It depends on the alternatives. Because workers in poor countries have low productivity across the board, they are offered low wages whether they produce goods exported to America or goods sold in local markets. A job that looks terrible by rich-country standards can be a step up for someone in a poor country.
International trade that depends on low-wage exports can nonetheless raise a country’s standard of living. This is especially true of very-low-wage nations. For example, Bangladesh and similar countries would be much poorer than they are—their citizens might even be starving—if they weren’t able to export goods such as clothing based on their low wage rates.
Sources of Comparative Advantage
International trade is driven by comparative advantage, but where does comparative advantage come from? Economists who study international trade have found three main sources of comparative advantage: international differences in climate, international differences in factor endowments, and international differences in technology.
Differences in Climate One key reason the opportunity cost of producing shrimp in Vietnam and Thailand is less than in the United States is that shrimp need warm water—Vietnam has plenty of that, but America doesn’t. In general, differences in climate play a significant role in international trade. Tropical countries export tropical products like coffee, sugar, bananas, and shrimp. Countries in the temperate zones export crops like wheat and corn. Some trade is even driven by the difference in seasons between the northern and southern hemispheres: winter deliveries of Chilean grapes and New Zealand apples have become commonplace in U.S. and European supermarkets.
Differences in Factor Endowments Canada is a major exporter of forest products—lumber and products derived from lumber, like pulp and paper—to the United States. These exports don’t reflect the special skill of Canadian lumberjacks. Canada has a comparative advantage in forest products because its forested area is much greater compared to the size of its labor force than the ratio of forestland to the labor force in the United States.
Forestland, like labor and capital, is a factor of production: an input used to produce goods and services. (Recall from Chapter 2 that the factors of production are land, labor, physical capital, and human capital.) Due to history and geography, the mix of available factors of production differs among countries, providing an important source of comparative advantage. The relationship between comparative advantage and factor availability is found in an influential model of international trade, the Heckscher–Ohlin model, developed by two Swedish economists in the first half of the twentieth century.
The factor intensity of production of a good is a measure of which factor is used in relatively greater quantities than other factors in production.
Two key concepts in the model are factor abundance and factor intensity. Factor abundance refers to how large a country’s supply of a factor is relative to its supply of other factors. Factor intensity refers to the fact that producers use different ratios of factors of production in the production of different goods. For example, oil refineries use much more capital per worker than clothing factories. Economists use the term factor intensity to describe this difference among goods: oil refining is capital-intensive, because it tends to use a high ratio of capital to labor, but auto seats production is labor-intensive, because it tends to use a high ratio of labor to capital.
According to the Heckscher–Ohlin model, a country has a comparative advantage in a good whose production is intensive in the factors that are abundantly available in that country.
According to the Heckscher–Ohlin model, a country that has an abundant supply of a factor of production will have a comparative advantage in goods whose production is intensive in that factor. So a country that has a relative abundance of capital will have a comparative advantage in capital-intensive industries such as oil refining, but a country that has a relative abundance of labor will have a comparative advantage in labor-intensive industries such as auto seats production.
The basic intuition behind this result is simple and based on opportunity cost. The opportunity cost of a given factor—the value that the factor would generate in alternative uses—is low for a country when it is relatively abundant in that factor. Relative to the United States, Mexico has an abundance of low-skilled labor. As a result, the opportunity cost of the production of low-skilled, labor-intensive goods is lower in Mexico than in the United States.
The most dramatic example of the validity of the Heckscher–Ohlin model is world trade in clothing. Clothing production is a labor-intensive activity: it doesn’t take much physical capital, nor does it require a lot of human capital in the form of highly educated workers. So you would expect labor-abundant countries such as China and Bangladesh to have a comparative advantage in clothing production. And they do.
That much international trade is the result of differences in factor endowments helps explain another fact: international specialization of production is often incomplete. That is, a country often maintains some domestic production of a good that it imports. A good example of this is the United States and oil. Saudi Arabia exports oil to the United States because Saudi Arabia has an abundant supply of oil relative to its other factors of production; the United States exports medical devices to Saudi Arabia because it has an abundant supply of expertise in medical technology relative to its other factors of production. But the United States also produces some oil domestically because the size of its domestic oil reserves in Texas and Alaska makes it economical to do so.
In our supply and demand analysis in the next section, we’ll consider incomplete specialization by a country to be the norm. We should emphasize, however, that the fact that countries often incompletely specialize does not in any way change the conclusion that there are gains from trade.
Differences in Technology In the 1970s and 1980s, Japan became by far the world’s largest exporter of automobiles, selling large numbers to the United States and the rest of the world. Japan’s comparative advantage in automobiles wasn’t the result of climate. Nor can it easily be attributed to differences in factor endowments: aside from a scarcity of land, Japan’s mix of available factors is quite similar to that in other advanced countries. Instead, Japan’s comparative advantage in automobiles was based on the superior production techniques developed by its manufacturers, which allowed them to produce more cars with a given amount of labor and capital than their American or European counterparts.
Japan’s comparative advantage in automobiles was a case of comparative advantage caused by differences in technology—the techniques used in production.
The causes of differences in technology are somewhat mysterious. Sometimes they seem to be based on knowledge accumulated through experience—for example, Switzerland’s comparative advantage in watches reflects a long tradition of watchmaking. Sometimes they are the result of a set of innovations that for some reason occur in one country but not in others. Technological advantage, however, is often transitory. For example, by adopting lean production, American auto manufacturers have now closed much of the gap in productivity with their Japanese competitors. In addition, Europe’s aircraft industry has closed a similar gap with the U.S. aircraft industry. At any given point in time, however, differences in technology are a major source of comparative advantage.
Increasing Returns to Scale and International Trade
Most analysis of international trade focuses on how differences between countries—differences in climate, factor endowments, and technology—create national comparative advantage. However, economists have also pointed out another reason for international trade: the role of increasing returns to scale.
Production of a good is characterized by increasing returns to scale if the productivity of labor and other resources used in production rise with the quantity of output. For example, in an industry characterized by increasing returns to scale, increasing output by 10% might require only 8% more labor and 9% more raw materials. Examples of industries with increasing returns to scale include auto manufacturing, oil refining, and the production of jumbo jets, all of which require large outlays of capital. Increasing returns to scale (sometimes also called economies of scale) can give rise to monopoly, a situation in which an industry is composed of only one producer, because it gives large firms a cost advantage over small ones.
But increasing returns to scale can also give rise to international trade. The logic runs as follows: If production of a good is characterized by increasing returns to scale, it makes sense to concentrate production in only a few locations, so each location has a high level of output. But that also means production occurs in only a few countries that export the good to other countries. A commonly cited example is the North American auto industry: although both the United States and Canada produce automobiles and their components, each particular model or component tends to be produced in only one of the two countries and exported to the other.
Increasing returns to scale probably play a large role in the trade in manufactured goods between advanced countries, which is about 25% of the total value of world trade.
Skill and Comparative Advantage
In 1953 U.S. workers were clearly better equipped with machinery than their counterparts in other countries. Most economists at the time thought that America’s comparative advantage lay in capital-intensive goods. But Wassily Leontief made a surprising discovery: America’s comparative advantage was in something other than capital-intensive goods. In fact, goods that the United States exported were slightly less capital-intensive than goods the country imported. This discovery came to be known as the Leontief paradox, and it led to a sustained effort to make sense of U.S. trade patterns.
The main resolution of this paradox, it turns out, depends on the definition of capital. U.S. exports aren’t intensive in physical capital—machines and buildings. Instead, they are skill-intensive—that is, they are intensive in human capital. U.S. exporting industries use a substantially higher ratio of highly educated workers to other workers than is found in U.S. industries that compete against imports. For example, one of America’s biggest export sectors is aircraft; the aircraft industry employs large numbers of engineers and other people with graduate degrees relative to the number of manual laborers. Conversely, we import a lot of clothing, which is often produced by workers with little formal education.
In general, countries with highly educated workforces tend to export skill-intensive goods, while countries with less educated workforces tend to export goods whose production requires little skilled labor. Figure 19-4 illustrates this point by comparing the goods the United States imports from Germany, a country with a highly educated labor force, with the goods the United States imports from Bangladesh, where about half of the adult population is still illiterate. In each country industries are ranked, first, according to how skill-intensive they are. Next, for each industry, we calculate its share of exports to the United States. This allows us to plot, for each country, various industries according to their skill intensity and their share of exports to the United States.
FIGURE 19-4 Education, Skill Intensity, and Trade

In Figure 19-4, the horizontal axis shows a measure of the skill intensity of different industries, and the vertical axes show the share of U.S. imports in each industry coming from Germany (on the left) and Bangladesh (on the right). As you can see, each country’s exports to the United States reflect its skill level. The curve representing Germany slopes upward: the more skill-intensive a German industry is, the higher its share of exports to the United States. In contrast, the curve representing Bangladesh slopes downward: the less skill-intensive a Bangladeshi industry is, the higher its share of exports to the United States.
Quick Review
- Imports and exports account for a growing share of the U.S. economy and the economies of many other countries.
- The growth of international trade and other international linkages is known as globalization.
- International trade is driven by comparative advantage. The Ricardian model of international trade shows that trade between two countries makes both countries better off than they would be in autarky—that is, there are gains from international trade.
- The main sources of comparative advantage are international differences in climate, factor endowments, and technology.
- The Heckscher–Ohlin model shows how comparative advantage can arise from differences in factor endowments: goods differ in their factor intensity, and countries tend to export goods that are intensive in the factors they have in abundance.
Check Your Understanding 19-1
Question
In the United States, the opportunity cost of 1 ton of corn is 50 bicycles. In China, the opportunity cost of 1 bicycle is 0.01 ton of corn. Which of the following is correct?
A. B. C. D. To determine comparative advantage, we must compare the two countries’ opportunity costs for a given good. Take the opportunity cost of 1 ton of corn in terms of bicycles. In China, the opportunity cost of 1 bicycle is 0.01 ton of corn; so the opportunity cost of 1 ton of corn is 1/0.01 bicycles = 100 bicycles. The United States has the comparative advantage in corn since its opportunity cost in terms of bicycles is 50, a smaller number. Similarly, the opportunity cost in the United States of 1 bicycle in terms of corn is 1/50 ton of corn = 0.02 ton of corn. This is greater than 0.01, the Chinese opportunity cost of 1 bicycle in terms of corn, implying that China has a comparative advantage in bicycles.Question
In the United States, the opportunity cost of 1 ton of corn is 50 bicycles. In China, the opportunity cost of 1 bicycle is 0.01 ton of corn. In autarky, the United States can produce 200,000 bicycles if no corn is produced, and China can produce 3,000 tons of corn if no bicycles are produced. Given this information, which of the following is correct?
A. B. C. D. Given that the United States can produce 200,000 bicycles if no corn is produced, it can produce 200,000 bicycles x 0.02 ton of corn/bicycle = 4,000 tons of corn when no bicycles are produced. Likewise, if China can produce 3,000 tons of corn if no bicycles are produced, it can produce 3,000 tons of corn x 100 bicycles/ton of corn = 300,000 bicycles if no corn is produced. These points determine the vertical and horizontal intercepts of the U.S. and Chinese production possibility frontiers.Question
In the United States, the opportunity cost of 1 ton of corn is 50 bicycles. In China, the opportunity cost of 1 bicycle is 0.01 ton of corn. With trade, each country specializes its production. The United States consumes 1,000 tons of corn and 200,000 bicycles; China consumes 3,000 tons of corn and 100,000 bicycles. Given this information, which of the following best explains the situation?
A. B. C. D. Each country is clearly better off with international trade because each now consumes a bundle of the two goods that lies outside its own production possibility frontier, indicating that these bundles were unattainable in autarky.
Question
Country A exports wine to the Country B and the Country B exports movies to Country A. Which of the following best explains this pattern using the Heckscher–Ohlin model?
A. B. C. D. According to the HeckscherOhlin model, this pattern of trade occurs because the Country B has a relatively larger endowment of factors of production, such as human capital and physical capital, that are suited to the production of movies, but Country A has a relatively larger endowment of factors of production suited to wine-making, such as vineyards and the human capital of vintners.
Solutions appear at back of book.