Problems
- Determine the amount of consumer surplus generated in each of the following situations.
Question
Leon goes to the clothing store to buy a new T-shirt, for which he is willing to pay up to $10. He picks out one he likes with a price tag of exactly $10. When he is paying for it, he learns that the T-shirt has been discounted by 50%.
Prob 4 1a. Leon goes to the clothing store to buy a new T-shirt, for which he is willing to pay up to $10. He picks out one he likes with a price tag of exactly $10. When he is paying for it, he learns that the T-shirt has been discounted by 50%.Question
Alberto goes to the CD store hoping to find a used copy of Nirvana’s Greatest Hits for up to $10. The store has one copy selling for $10, which he purchases.
Prob 4 1b. Alberto goes to the CD store hoping to find a used copy of Nirvana’s Greatest Hits for up to $10. The store has one copy selling for $10, which he purchases.Question
After soccer practice, Stacey is willing to pay $2 for a bottle of mineral water. The 7-Eleven sells mineral water for $2.25 per bottle, so she declines to purchase it.
Prob 4 1c. After soccer practice, Stacey is willing to pay $2 for a bottle of mineral water. The 7-Eleven sells mineral water for $2.25 per bottle, so she declines to purchase it.
- Determine the amount of producer surplus generated in each of the following situations.
Question
Gordon lists his old Lionel electric trains on eBay. He sets a minimum acceptable price, known as his reserve price, of $75. After five days of bidding, the final high bid is exactly $75. He accepts the bid.
Prob 4 2a. Gordon lists his old Lionel electric trains on eBay. He sets a minimum acceptable price, known as his reserve price, of $75. After five days of bidding, the final high bid is exactly $75. He accepts the bid.Question
So-Hee advertises her car for sale in the used-car section of the student newspaper for $2,000, but she is willing to sell the car for any price higher than $1,500. The best offer she gets is $1,200, which she declines.
Prob 4 2b. So-Hee advertises her car for sale in the used-car section of the student newspaper for $2,000, but she is willing to sell the car for any price higher than $1,500. The best offer she gets is $1,200, which she declines.Question
Sanjay likes his job so much that he would be willing to do it for free. However, his annual salary is $80,000.
Prob 4 2c. Sanjay likes his job so much that he would be willing to do it for free. However, his annual salary is $80,000.
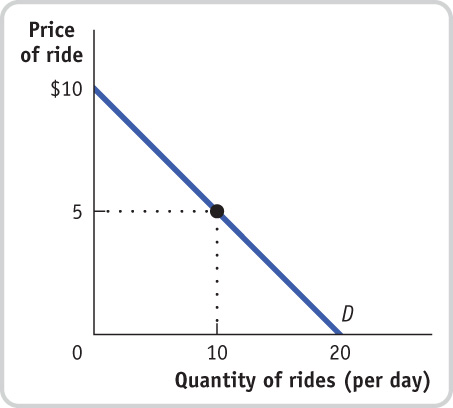
- You are the manager of Fun World, a small amusement park. The accompanying diagram shows the demand curve of a typical customer at Fun World.
Question
Suppose that the price of each ride is $5. At that price, how much consumer surplus does an individual consumer get? (Recall that the area of a right triangle is ½ × the height of the triangle × the base of the triangle.)
Prob 4 3a. Suppose that the price of each ride is $5. At that price, how much consumer surplus does an individual consumer get? (Recall that the area of a right triangle is ½ × the height of the triangle × the base of the triangle.)Question
Suppose that Fun World considers charging an admission fee, even though it maintains the price of each ride at $5. What is the maximum admission fee it could charge? (Assume that all potential customers have enough money to pay the fee.)
Prob 4 3b. Suppose that Fun World considers charging an admission fee, even though it maintains the price of each ride at $5. What is the maximum admission fee it could charge? (Assume that all potential customers have enough money to pay the fee.)Question
Suppose that Fun World lowered the price of each ride to zero. How much consumer surplus does an individual consumer get? What is the maximum admission fee Fun World could charge?
Prob 4 3c. Suppose that Fun World lowered the price of each ride to zero. How much consumer surplus does an individual consumer get? What is the maximum admission fee Fun World could charge?
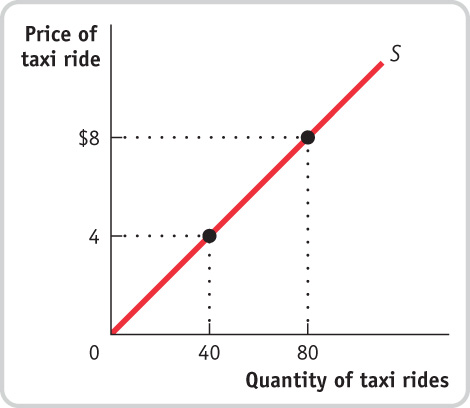
- The accompanying diagram illustrates a taxi driver’s individual supply curve (assume that each taxi ride is the same distance).
Question
Suppose the city sets the price of taxi rides at $4 per ride, and at $4 the taxi driver is able to sell as many taxi rides as he desires. What is this taxi driver’s producer surplus? (Recall that the area of a right triangle is ½ × the height of the triangle × the base of the triangle.)
Prob 4 4a. Suppose the city sets the price of taxi rides at $4 per ride, and at $4 the taxi driver is able to sell as many taxi rides as he desires. What is this taxi driver’s producer surplus? (Recall that the area of a right triangle is ½ × the height of the triangle × the base of the triangle.)Question
Suppose that the city keeps the price of a taxi ride set at $4, but it decides to charge taxi drivers a “licensing fee.” What is the maximum licensing fee the city could extract from this taxi driver?
Prob 4 4a. Suppose that the city keeps the price of a taxi ride set at $4, but it decides to charge taxi drivers a “licensing fee.” What is the maximum licensing fee the city could extract from this taxi driver?Question
Suppose that the city allowed the price of taxi rides to increase to $8 per ride. Again assume that, at this price, the taxi driver sells as many rides as he is willing to offer. How much producer surplus does an individual taxi driver now get? What is the maximum licensing fee the city could charge this taxi driver?
Prob 4 4a. Suppose that the city allowed the price of taxi rides to increase to $8 per ride. Again assume that, at this price, the taxi driver sells as many rides as he is willing to offer. How much producer surplus does an individual taxi driver now get? What is the maximum licensing fee the city could charge this taxi driver?
- Suppose it is decided that rent control in New York City will be abolished and that market rents will now prevail. Assume that all rental units are identical and so are offered at the same rent. To address the plight of residents who may be unable to pay the market rent, an income supplement will be paid to all low-income households equal to the difference between the old controlled rent and the new market rent.
Question
Use a diagram to show the effect on the rental market of the elimination of rent control. What will happen to the quality and quantity of rental housing supplied?
Prob 4 5a. Use a diagram to show the effect on the rental market of the elimination of rent control. What will happen to the quality and quantity of rental housing supplied?Question
Use a second diagram to show the additional effect of the income-supplement policy on the market. What effect does it have on the market rent and quantity of rental housing supplied in comparison to your answers to part a?
Prob 4 5b. Use a second diagram to show the additional effect of the income-supplement policy on the market. What effect does it have on the market rent and quantity of rental housing supplied in comparison to your answers to part a?Question
Are tenants better or worse off as a result of these policies? Are landlords better or worse off? Is society as a whole better or worse off?
Prob 4 5c. Are tenants better or worse off as a result of these policies? Are landlords better or worse off? Is society as a whole better or worse off?Question
From a political standpoint, why do you think cities have been more likely to resort to rent control rather than a policy of income supplements to help low-income people pay for housing?
Prob 4 5d. From a political standpoint, why do you think cities have been more likely to resort to rent control rather than a policy of income supplements to help low-income people pay for housing?
- In order to ingratiate himself with voters, the mayor of Gotham City decides to lower the price of taxi rides. Assume, for simplicity, that all taxi rides are the same distance and therefore cost the same. The accompanying table shows the demand and supply schedules for taxi rides.
Quantity of rides (millions per year) Fare (per ride) Quantity demanded Quantity supplied $7.00 10 12 6.50 11 11 6.00 12 10 5.50 13 9 5.00 14 8 4.50 15 7 Question
Assume that there are no restrictions on the number of taxi rides that can be supplied (there is no medallion system). Find the equilibrium price and quantity.
Prob 4 6a. Assume that there are no restrictions on the number of taxi rides that can be supplied (there is no medallion system). Find the equilibrium price and quantity.Question
Suppose that the mayor sets a price ceiling at $5.50. How large is the shortage of rides? Illustrate with a diagram. Who loses and who benefits from this policy?
Prob 4 6b. Suppose that the mayor sets a price ceiling at $5.50. How large is the shortage of rides? Illustrate with a diagram. Who loses and who benefits from this policy?Question
Suppose that the stock market crashes and, as a result, people in Gotham City are poorer. This reduces the quantity of taxi rides demanded by 6 million rides per year at any given price. What effect will the mayor’s new policy have now? Illustrate with a diagram.
Prob 4 6c. Suppose that the stock market crashes and, as a result, people in Gotham City are poorer. This reduces the quantity of taxi rides demanded by 6 million rides per year at any given price. What effect will the mayor’s new policy have now? Illustrate with a diagram.Question
Suppose that the stock market rises and the demand for taxi rides returns to normal (that is, returns to the demand schedule given in the table). The mayor now decides to ingratiate himself with taxi drivers. He announces a policy in which operating licenses are given to existing taxi drivers; the number of licenses is restricted such that only 10 million rides per year can be given. Illustrate the effect of this policy on the market, and indicate the resulting price and quantity transacted. What is the quota rent per ride?
Prob 4 6d. Suppose that the stock market rises and the demand for taxi rides returns to normal (that is, returns to the demand schedule given in the table). The mayor now decides to ingratiate himself with taxi drivers. He announces a policy in which operating licenses are given to existing taxi drivers; the number of licenses is restricted such that only 10 million rides per year can be given. Illustrate the effect of this policy on the market, and indicate the resulting price and quantity transacted. What is the quota rent per ride?
- In the late eighteenth century, the price of bread in New York City was controlled, set at a predetermined price above the market price.
Question
Draw a diagram showing the effect of the policy. Did the policy act as a price ceiling or a price floor?
Prob 4 7a. Draw a diagram showing the effect of the policy. Did the policy act as a price ceiling or a price floor?Question
What kinds of inefficiencies were likely to have arisen when the controlled price of bread was above the market price? Explain in detail.
Prob 4 7b. What kinds of inefficiencies were likely to have arisen when the controlled price of bread was above the market price? Explain in detail.Question
Draw a diagram showing the effect of the price control on the market for bread during this one-year period. Did the policy act as a price ceiling or a price floor?
Prob 4 7c. Draw a diagram showing the effect of the price control on the market for bread during this one-year period. Did the policy act as a price ceiling or a price floor?Question
What kinds of inefficiencies do you think occurred during this period? Explain in detail.
Prob 4 7d. What kinds of inefficiencies do you think occurred during this period? Explain in detail.
One year during this period, a poor wheat harvest caused a leftward shift in the supply of bread and therefore an increase in its market price. New York bakers found that the controlled price of bread in New York was below the market price.
- European governments tend to make greater use of price controls than does the U.S. government. For example, the French government sets minimum starting yearly wages for new hires who have completed le bac, certification roughly equivalent to a high school diploma. The demand schedule for new hires with le bac and the supply schedule for similarly credentialed new job seekers are given in the accompanying table. The price here—given in euros, the currency used in France—is the same as the yearly wage.
Wage (per year) Quantity demanded (new job offers per year) Quantity supplied (new job seekers per year) Є45,000 200,000 325,000 40,000 220,000 320,000 35,000 250,000 310,000 30,000 290,000 290,000 25,000 370,000 200,000 Question
In the absence of government interference, what are the equilibrium wage and number of graduates hired per year? Illustrate with a diagram. Will there be anyone seeking a job at the equilibrium wage who is unable to find one—that is, will there be anyone who is involuntarily unemployed?
Prob 4 8a. In the absence of government interference, what are the equilibrium wage and number of graduates hired per year? Illustrate with a diagram. Will there be anyone seeking a job at the equilibrium wage who is unable to find one—that is, will there be anyone who is involuntarily unemployed?Question
Suppose the French government sets a minimum yearly wage of €35,000. Is there any involuntary unemployment at this wage? If so, how much? Illustrate with a diagram. What if the minimum wage is set at €40,000? Also illustrate with a diagram.
Prob 4 8b. Suppose the French government sets a minimum yearly wage of €35,000. Is there any involuntary unemployment at this wage? If so, how much? Illustrate with a diagram. What if the minimum wage is set at €40,000? Also illustrate with a diagram.Question
Given your answer to part b and the information in the table, what do you think is the relationship between the level of involuntary unemployment and the level of the minimum wage? Who benefits from such a policy? Who loses? What is the missed opportunity here?
Prob 4 8c. Given your answer to part b and the information in the table, what do you think is the relationship between the level of involuntary unemployment and the level of the minimum wage? Who benefits from such a policy? Who loses? What is the missed opportunity here?
Question
Until recently, the standard number of hours worked per week for a full-time job in France was 39 hours, just as in the United States. But in response to social unrest over high levels of involuntary unemployment, the French government instituted a 35-hour workweek—a worker could not work more than 35 hours per week even if both the worker and employer wanted it. The motivation behind this policy was that if current employees worked fewer hours, employers would be forced to hire more new workers. Assume that it is costly for employers to train new workers. French employers were greatly opposed to this policy and threatened to move their operations to neighboring countries that did not have such employment restrictions. Can you explain their attitude? Give an example of both an inefficiency and an illegal activity that are likely to arise from this policy.
Prob 4 9. Until recently, the standard number of hours worked per week for a full-time job in France was 39 hours, just as in the United States. But in response to social unrest over high levels of involuntary unemployment, the French government instituted a 35-hour workweek—a worker could not work more than 35 hours per week even if both the worker and employer wanted it. The motivation behind this policy was that if current employees worked fewer hours, employers would be forced to hire more new workers. Assume that it is costly for employers to train new workers. French employers were greatly opposed to this policy and threatened to move their operations to neighboring countries that did not have such employment restrictions. Can you explain their attitude? Give an example of both an inefficiency and an illegal activity that are likely to arise from this policy.- The waters off the North Atlantic coast were once teeming with fish. But because of over-fishing by the commercial fishing industry, the stocks of fish are seriously depleted. In 1991, the National Marine Fishery Service of the U.S. government implemented a quota to allow fish stocks to recover. The quota limited the amount of swordfish caught per year by all U.S.-licensed fishing boats to 7 million pounds. As soon as the U.S. fishing fleet had met the quota limit, the swordfish catch was closed down for the rest of the year. The accompanying table gives the hypothetical demand and supply schedules for swordfish caught in the United States per year.
Quantity of swordfish (millions of pounds per year) Price of swordfish (per pound) Quantity demanded Quantity supplied $20 6 15 18 7 13 16 8 11 14 9 9 12 10 7 Question
Use a diagram to show the effect of the quota on the market for swordfish in 1991. In your diagram, illustrate the deadweight loss from inefficiently low quantity.
Prob 4 10a. Use a diagram to show the effect of the quota on the market for swordfish in 1991. In your diagram, illustrate the deadweight loss from inefficiently low quantity.Question
How do you think fishermen will change how they fish in response to this policy?
Prob 4 10a. How do you think fishermen will change how they fish in response to this policy?
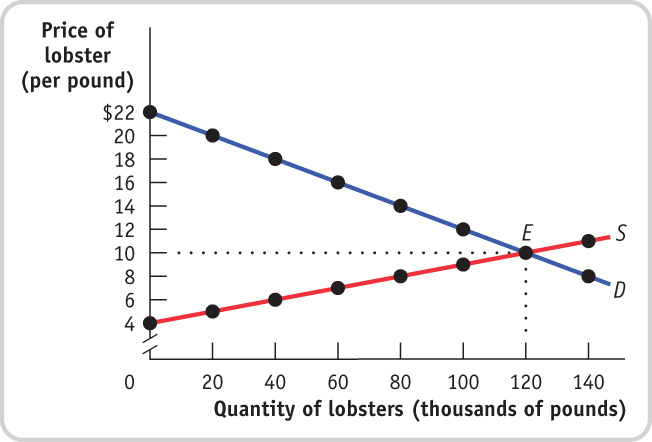
- In Maine, you must have a license to harvest lobster commercially; these licenses are issued yearly. The state of Maine is concerned about the dwindling supplies of lobsters found off its coast. The state fishery department has decided to place a yearly quota of 80,000 pounds of lobsters harvested in all Maine waters. It has also decided to give licenses this year only to those fishermen who had licenses last year. The accompanying diagram shows the demand and supply curves for Maine lobsters.Page 139
Question
In the absence of government restrictions, what are the equilibrium price and quantity?
Prob 4 11a. In the absence of government restrictions, what are the equilibrium price and quantity?Question
What is the demand price at which consumers wish to purchase 80,000 pounds of lobsters?
Prob 4 11b. What is the demand price at which consumers wish to purchase 80,000 pounds of lobsters?Question
What is the supply price at which suppliers are willing to supply 80,000 pounds of lobsters?
Prob 4 11c. What is the supply price at which suppliers are willing to supply 80,000 pounds of lobsters?Question
What is the quota rent per pound of lobster when 80,000 pounds are sold? Illustrate the quota rent and the deadweight loss on the diagram.
Prob 4 11d. What is the quota rent per pound of lobster when 80,000 pounds are sold? Illustrate the quota rent and the deadweight loss on the diagram.Question
Explain a transaction that benefits both buyer and seller but is prevented by the quota restriction.
Prob 4 11e. Explain a transaction that benefits both buyer and seller but is prevented by the quota restriction.
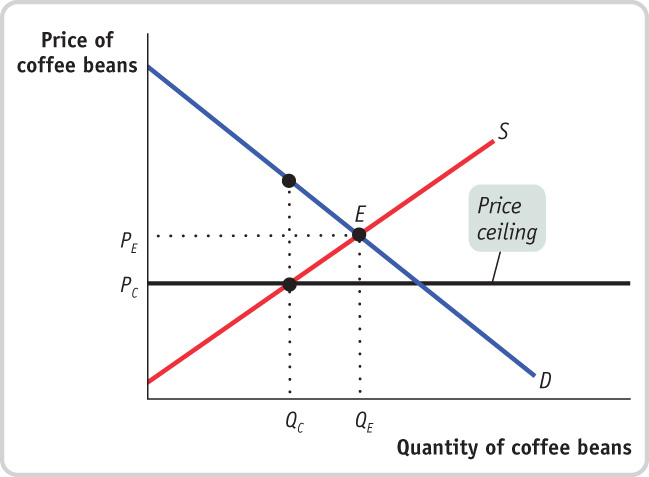
- The Venezuelan government has imposed a price ceiling on the retail price of roasted coffee beans. The accompanying diagram shows the market for coffee beans. In the absence of price controls, the equilibrium is at point E, with an equilibrium price of PE and an equilibrium quantity bought and sold of QE.
Question
Show the consumer and producer surplus before the introduction of the price ceiling.
Prob 4 12a. Show the consumer and producer surplus before the introduction of the price ceiling.Question
Show the consumer surplus after the introduction of the price ceiling (assuming that the consumers with the highest willingness to pay get to buy the available coffee beans; that is, assuming that there is no inefficient allocation to consumers).
Prob 4 12b. Show the consumer surplus after the introduction of the price ceiling (assuming that the consumers with the highest willingness to pay get to buy the available coffee beans; that is, assuming that there is no inefficient allocation to consumers).Question
Show the producer surplus after the introduction of the price ceiling (assuming that the producers with the lowest cost get to sell their coffee beans; that is, assuming that there is no inefficient allocation of sales among producers).
Prob 4 12c. Show the producer surplus after the introduction of the price ceiling (assuming that the producers with the lowest cost get to sell their coffee beans; that is, assuming that there is no inefficient allocation of sales among producers).Question
Using the diagram, show how much of what was producer surplus before the introduction of the price ceiling has been transferred to consumers as a result of the price ceiling.
Prob 4 12d. Using the diagram, show how much of what was producer surplus before the introduction of the price ceiling has been transferred to consumers as a result of the price ceiling.Question
Using the diagram, show how much of what was total surplus before the introduction of the price ceiling has been lost. That is, how great is the deadweight loss?
Prob 4 12e. Using the diagram, show how much of what was total surplus before the introduction of the price ceiling has been lost. That is, how great is the deadweight loss?
After the introduction of the price ceiling, the price falls to PC and the quantity bought and sold falls to QC.
Extend Your Understanding
Question
According to the Bureau of Transportation Statistics, due to an increase in demand, the average domestic airline fare increased from $319.85 in the fourth quarter of 2009 to $328.12 in the first quarter of 2010, an increase of $8.27. The number of passenger tickets sold in the fourth quarter of 2009 was 151.4 million. Over the same period, the airlines’ costs remained roughly the same: the price of jet fuel averaged around $2 per gallon in both quarters (Source: Energy Information Administration), and airline pilots’ salaries remained roughly the same (according to the Bureau of Labor Statistics, they averaged $117,060 per year in 2009).
Can you determine precisely by how much producer surplus has increased as a result of the $8.27 increase in the average fare? If you cannot be precise, can you determine whether it will be less than, or more than, a specific amount?Prob 4 13. According to the Bureau of Transportation Statistics, due to an increase in demand, the average domestic airline fare increased from $319.85 in the fourth quarter of 2009 to $328.12 in the first quarter of 2010, an increase of $8.27. The number of passenger tickets sold in the fourth quarter of 2009 was 151.4 million. Over the same period, the airlines’ costs remained roughly the same: the price of jet fuel averaged around $2 per gallon in both quarters (Source: Energy Information Administration), and airline pilots’ salaries remained roughly the same (according to the Bureau of Labor Statistics, they averaged $117,060 per year in 2009).
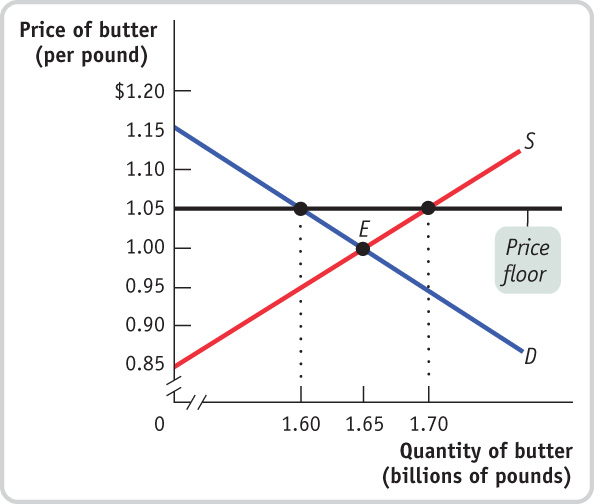
Can you determine precisely by how much producer surplus has increased as a result of the $8.27 increase in the average fare? If you cannot be precise, can you determine whether it will be less than, or more than, a specific amount?- The U.S. Department of Agriculture (USDA) administers the price floor for butter, which the 2008 Farm Bill set at $1.05 per pound. At that price, according to data from the USDA, the quantity of butter supplied in 2010 was 1.7 billion pounds, and the quantity demanded was 1.6 billion pounds. To support the price of butter at the price floor, the USDA therefore had to buy up 100 million pounds of butter. The accompanying diagram shows supply and demand curves illustrating the market for butter.Page 140
Question
In the absence of a price floor, how much consumer surplus is created? How much producer surplus? What is the total surplus?
Prob 4 14a. In the absence of a price floor, how much consumer surplus is created? How much producer surplus? What is the total surplus?Question
With the price floor at $1.05 per pound of butter, consumers buy 1.6 billion pounds of butter. How much consumer surplus is created now?
Prob 4 14b. With the price floor at $1.05 per pound of butter, consumers buy 1.6 billion pounds of butter. How much consumer surplus is created now?Question
With the price floor at $1.05 per pound of butter, producers sell 1.7 billion pounds of butter (some to consumers and some to the USDA). How much producer surplus is created now?
Prob 4 14c. With the price floor at $1.05 per pound of butter, producers sell 1.7 billion pounds of butter (some to consumers and some to the USDA). How much producer surplus is created now?Question
How much money does the USDA spend on buying up surplus butter?
Prob 4 14d. How much money does the USDA spend on buying up surplus butter?Question
Taxes must be collected to pay for the purchases of surplus butter by the USDA. As a result, total surplus (producer plus consumer) is reduced by the amount the USDA spent on buying surplus butter. Using your answers for parts b–d, what is the total surplus when there is a price floor? How does this compare to the total surplus without a price floor from part a?
Prob 4 14e. Taxes must be collected to pay for the purchases of surplus butter by the USDA. As a result, total surplus (producer plus consumer) is reduced by the amount the USDA spent on buying surplus butter. Using your answers for parts b–d, what is the total surplus when there is a price floor? How does this compare to the total surplus without a price floor from part a?
- The accompanying table shows hypothetical demand and supply schedules for milk per year. The U.S. government decides that the incomes of dairy farmers should be maintained at a level that allows the traditional family dairy farm to survive. So it implements a price floor of $1 per pint by buying surplus milk until the market price is $1 per pint.
Quantity of milk (millions of pints per year) Price of milk (per pint) Quantity demanded Quantity supplied $1.20 550 850 1.10 600 800 1.00 650 750 0.90 700 700 0.80 750 650 Question
In a diagram, show the deadweight loss from the inefficiently low quantity bought and sold.
Prob 4 15a. In a diagram, show the deadweight loss from the inefficiently low quantity bought and sold.Question
How much surplus milk will be produced as a result of this policy?
Prob 4 15b. How much surplus milk will be produced as a result of this policy?Question
What will be the cost to the government of this policy?
Prob 4 15c. What will be the cost to the government of this policy?Question
Since milk is an important source of protein and calcium, the government decides to provide the surplus milk it purchases to elementary schools at a price of only $0.60 per pint. Assume that schools will buy any amount of milk available at this low price. But parents now reduce their purchases of milk at any price by 50 million pints per year because they know their children are getting milk at school. How much will the dairy program now cost the government?
Prob 4 15d. Since milk is an important source of protein and calcium, the government decides to provide the surplus milk it purchases to elementary schools at a price of only $0.60 per pint. Assume that schools will buy any amount of milk available at this low price. But parents now reduce their purchases of milk at any price by 50 million pints per year because they know their children are getting milk at school. How much will the dairy program now cost the government?Question
Explain how inefficiencies in the form of inefficient allocation of sales among sellers and wasted resources arise from this policy.
Prob 4 15e. Explain how inefficiencies in the form of inefficient allocation of sales among sellers and wasted resources arise from this policy.
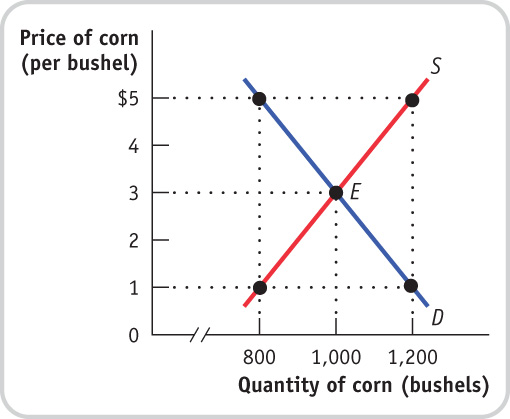
- For the last 70 years the U.S. government has used price supports to provide income assistance to American farmers. To implement these price supports, at times the government has used price floors, which it maintains by buying up the surplus farm products. At other times, it has used target prices, a policy by which the government gives the farmer an amount equal to the difference between the market price and the target price for each unit sold. Consider the market for corn depicted in the accompanying diagram.
Question
If the government sets a price floor of $5 per bushel, how many bushels of corn are produced? How many are purchased by consumers? By the government? How much does the program cost the government? How much revenue do corn farmers receive?
Prob 4 16a. If the government sets a price floor of $5 per bushel, how many bushels of corn are produced? How many are purchased by consumers? By the government? How much does the program cost the government? How much revenue do corn farmers receive?Question
Suppose the government sets a target price of $5 per bushel for any quantity supplied up to 1,000 bushels. How many bushels of corn are purchased by consumers and at what price? By the government? How much does the program cost the government? How much revenue do corn farmers receive?
Prob 4 16b. Suppose the government sets a target price of $5 per bushel for any quantity supplied up to 1,000 bushels. How many bushels of corn are purchased by consumers and at what price? By the government? How much does the program cost the government? How much revenue do corn farmers receive?Question
Which of these programs (in parts a and b) costs corn consumers more? Which program costs the government more? Explain.
Prob 4 16c. Which of these programs (in parts a and b) costs corn consumers more? Which program costs the government more? Explain.Question
Is one of these policies less inefficient than the other? Explain.
Prob 4 16d. Is one of these policies less inefficient than the other? Explain.
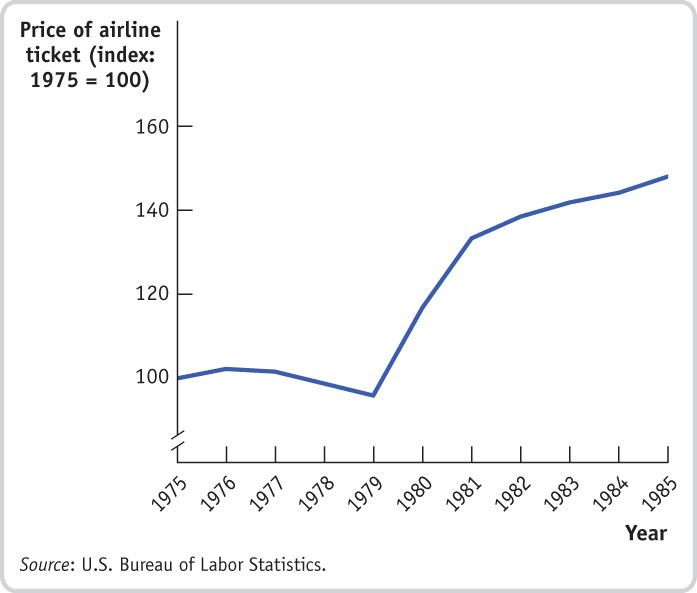
- The accompanying diagram shows data from the U.S. Bureau of Labor Statistics on the average price of an airline ticket in the United States from 1975 until 1985, adjusted to eliminate the effect of inflation (the general increase in the prices of all goods over time). In 1978, the United States Airline Deregulation Act removed the price floor on airline fares, and it also allowed the airlines greater flexibility to offer new routes.
Question
Looking at the data on airline ticket prices in the diagram, do you think the price floor that existed before 1978 was binding or nonbinding? That is, do you think it was set above or below the equilibrium price? Draw a supply and demand diagram, showing where the price floor that existed before 1978 was in relation to the equilibrium price.
Prob 4 17a. Looking at the data on airline ticket prices in the diagram, do you think the price floor that existed before 1978 was binding or nonbinding? That is, do you think it was set above or below the equilibrium price? Draw a supply and demand diagram, showing where the price floor that existed before 1978 was in relation to the equilibrium price.Question
Most economists agree that the average airline ticket price per mile traveled actually fell as a result of the Airline Deregulation Act. How might you reconcile that view with what you see in the diagram?
Prob 4 17b. Most economists agree that the average airline ticket price per mile traveled actually fell as a result of the Airline Deregulation Act. How might you reconcile that view with what you see in the diagram?