Problems
- Nile.com, the online bookseller, wants to increase its total revenue. One strategy is to offer a 10% discount on every book it sells. Nile.com knows that its customers can be divided into two distinct groups according to their likely responses to the discount. The accompanying table shows how the two groups respond to the discount.
Group A (sales per week) Group B (sales per week) Volume of sales before the 10% discount 1.55 million 1.50 million Volume of sales after the 10% discount 1.65 million 1.70 million Question
Using the midpoint method, calculate the price elasticities of demand for group A and group B.
Prob 5 1a. Using the midpoint method, calculate the price elasticities of demand for group A and group B.Question
Explain how the discount will affect total revenue from each group.
Prob 5 1b. Explain how the discount will affect total revenue from each group.
- Do you think the price elasticity of demand for Ford sport-utility vehicles (SUVs) will increase, decrease, or remain the same when each of the following events occurs? Explain your answer.
Question
Other car manufacturers, such as General Motors, decide to make and sell SUVs.
Prob 5 2a. Other car manufacturers, such as General Motors, decide to make and sell SUVs.Question
SUVs produced in foreign countries are banned from the American market.
Prob 5 2a. SUVs produced in foreign countries are banned from the American market.Question
Due to ad campaigns, Americans believe that SUVs are much safer than ordinary passenger cars.
Prob 5 2a. Due to ad campaigns, Americans believe that SUVs are much safer than ordinary passenger cars.Question
The time period over which you measure the elasticity lengthens. During that longer time,new models such as four-wheel-drive cargo vans appear.
Prob 5 2a. The time period over which you measure the elasticity lengthens. During that longer time,new models such as four-wheel-drive cargo vans appear.
- In the United States, 2007 was a bad year for growing wheat. And as wheat supply decreased, the price of wheat rose dramatically, leading to a lower quantity demanded (a movement along the demand curve). The accompanying table describes what happened to prices and the quantity of wheat demanded.
2006 2007 Quantity demanded (bushels) 2.2 billion 2.0 billion Average price (per bushel) $3.42 $4.26 Page 175Question
Using the midpoint method, calculate the price elasticity of demand for winter wheat.
Prob 5 3a. Using the midpoint method, calculate the price elasticity of demand for winter wheat.Question
What is the total revenue for U.S. wheat farmers in 2006 and 2007?
Prob 5 3b. What is the total revenue for U.S. wheat farmers in 2006 and 2007?Question
Did the bad harvest increase or decrease the total revenue of U.S. wheat farmers? How could you have predicted this from your answer to part a?
Prob 5 3c. Did the bad harvest increase or decrease the total revenue of U.S. wheat farmers? How could you have predicted this from your answer to part a?
- The accompanying table gives part of the supply schedule for personal computers in the United States.
Price of computer Quantity of computers supplied $1,100 12,000 900 8,000 Question
Calculate the price elasticity of supply when the price increases from $900 to $1,100 using the midpoint method.
Prob 5 4a. Calculate the price elasticity of supply when the price increases from $900 to $1,100 using the midpoint method.Question
Suppose firms produce 1,000 more computers at any given price due to improved technology. As price increases from $900 to $1,100, is the price elasticity of supply now greater than, less than, or the same as it was in part a?
Prob 5 4b. Suppose firms produce 1,000 more computers at any given price due to improved technology. As price increases from $900 to $1,100, is the price elasticity of supply now greater than, less than, or the same as it was in part a?Question
Suppose a longer time period under consideration means that the quantity supplied at any given price is 20% higher than the figures given in the table. As price increases from $900 to $1,100, is the price elasticity of supply now greater than, less than, or the same as it was in part a?
Prob 5 4c. Suppose a longer time period under consideration means that the quantity supplied at any given price is 20% higher than the figures given in the table. As price increases from $900 to $1,100, is the price elasticity of supply now greater than, less than, or the same as it was in part a?
- What can you conclude about the price elasticity of demand in each of the following statements?
Question
“The pizza delivery business in this town is very competitive. I’d lose half my customers if I raised the price by as little as 10%.”
Prob 5 5a. “The pizza delivery business in this town is very competitive. I’d lose half my customers if I raised the price by as little as 10%.”Question
“I owned both of the two Jerry Garcia autographed lithographs in existence. I sold one on eBay for a high price. But when I sold the second one, the price dropped by 80%.”
Prob 5 5b. “I owned both of the two Jerry Garcia autographed lithographs in existence. I sold one on eBay for a high price. But when I sold the second one, the price dropped by 80%.”Question
“My economics professor has chosen to use the Krugman/Wells textbook for this class. I have no choice but to buy this book.”
Prob 5 5c. “My economics professor has chosen to use the Krugman/Wells textbook for this class. I have no choice but to buy this book.”Question
“I always spend a total of exactly $10 per week on coffee.”
Prob 5 5d. “I always spend a total of exactly $10 per week on coffee.”
- The accompanying table shows the price and yearly quantity sold of souvenir T-shirts in the town of Crystal Lake according to the average income of the tourists visiting.
Price of T-shirt Quantity of T-shirts demanded when average tourist income is $20,000 Quantity of T-shirts demanded when average tourist income is $30,000 $4 3,000 5,000 5 2,400 4,200 6 1,600 3,000 7 800 1,800 Question
Using the midpoint method, calculate the price elasticity of demand when the price of a T-shirt rises from $5 to $6 and the average tourist income is $20,000. Also calculate it when the average tourist income is $30,000.
Prob 5 6a. Using the midpoint method, calculate the price elasticity of demand when the price of a T-shirt rises from $5 to $6 and the average tourist income is $20,000. Also calculate it when the average tourist income is $30,000.Question
Using the midpoint method, calculate the income elasticity of demand when the price of a T-shirt is $4 and the average tourist income increases from $20,000 to $30,000. Also calculate it when the price is $7.
Prob 5 6b. Using the midpoint method, calculate the income elasticity of demand when the price of a T-shirt is $4 and the average tourist income increases from $20,000 to $30,000. Also calculate it when the price is $7.
- A recent study determined the following elasticities for Volkswagen Beetles:
Price elasticity of demand = 2
Income elasticity of demand = 1.5
The supply of Beetles is elastic. Based on this information, are the following statements true or false? Explain your reasoning.Question
A 10% increase in the price of a Beetle will reduce the quantity demanded by 20%.
Prob 5 7a. A 10% increase in the price of a Beetle will reduce the quantity demanded by 20%.Question
An increase in consumer income will increase the price and quantity of Beetles sold. Since price elasticity of demand is greater than 1, total revenue will go down.
Prob 5 7b. An increase in consumer income will increase the price and quantity of Beetles sold. Since price elasticity of demand is greater than 1, total revenue will go down.
- In each of the following cases, do you think the price elasticity of supply is (i) perfectly elastic; (ii) perfectly inelastic; (iii) elastic, but not perfectly elastic; or (iv) inelastic, but not perfectly inelastic? Explain using a diagram.
Question
An increase in demand this summer for luxury cruises leads to a huge jump in the sales price of a cabin on the Queen Mary 2.
Prob 5 8a. An increase in demand this summer for luxury cruises leads to a huge jump in the sales price of a cabin on the Queen Mary 2.Question
The price of a kilowatt of electricity is the same during periods of high electricity demand as during periods of low electricity demand.
Prob 5 8b. The price of a kilowatt of electricity is the same during periods of high electricity demand as during periods of low electricity demand.Question
Fewer people want to fly during February than during any other month. The airlines cancel about 10% of their flights as ticket prices fall about 20% during this month.
Prob 5 8c. Fewer people want to fly during February than during any other month. The airlines cancel about 10% of their flights as ticket prices fall about 20% during this month.Question
Owners of vacation homes in Maine rent them out during the summer. Due to the soft economy this year, a 30% decline in the price of a vacation rental leads more than half of homeowners to occupy their vacation homes themselves during the summer.
Prob 5 8d. Owners of vacation homes in Maine rent them out during the summer. Due to the soft economy this year, a 30% decline in the price of a vacation rental leads more than half of homeowners to occupy their vacation homes themselves during the summer.
- Use an elasticity concept to explain each of the following observations.
Question
During economic booms, the number of new personal care businesses, such as gyms and tanning salons, is proportionately greater than the number of other new businesses, such as grocery stores.
Prob 5 9a. During economic booms, the number of new personal care businesses, such as gyms and tanning salons, is proportionately greater than the number of other new businesses, such as grocery stores.Question
Cement is the primary building material in Mexico. After new technology makes cement cheaper to produce, the supply curve for the Mexican cement industry becomes relatively flatter.
Prob 5 9b. Cement is the primary building material in Mexico. After new technology makes cement cheaper to produce, the supply curve for the Mexican cement industry becomes relatively flatter.Question
Some goods that were once considered luxuries, like a telephone, are now considered virtual necessities. As a result, the demand curve for telephone services has become steeper over time.
Prob 5 9c. Some goods that were once considered luxuries, like a telephone, are now considered virtual necessities. As a result, the demand curve for telephone services has become steeper over time.Question
Consumers in a less developed country like Guatemala spend proportionately more of their income on equipment for producing things at home, like sewing machines, than consumers in a more developed country like Canada.
Prob 5 9d. Consumers in a less developed country like Guatemala spend proportionately more of their income on equipment for producing things at home, like sewing machines, than consumers in a more developed country like Canada.
Page 176 - There is a debate about whether sterile hypodermic needles should be passed out free of charge in cities with high drug use. Proponents argue that doing so will reduce the incidence of diseases, such as HIV/AIDS, that are often spread by needle sharing among drug users. Opponents believe that doing so will encourage more drug use by reducing the risks of this behavior. As an economist asked to assess the policy, you must know the following: (i) how responsive the spread of diseases like HIV/AIDS is to the price of sterile needles and (ii) how responsive drug use is to the price of sterile needles. Assuming that you know these two things, use the concepts of price elasticity of demand for sterile needles and the cross-price elasticity between drugs and sterile needles to answer the following questions.
Question
In what circumstances do you believe this is a beneficial policy?
Prob 5 10a. In what circumstances do you believe this is a beneficial policy?Question
In what circumstances do you believe this is a bad policy?
Prob 5 10b. In what circumstances do you believe this is a bad policy?
Question
Worldwide, the average coffee grower has increased the amount of acreage under cultivation over the past few years. The result has been that the average coffee plantation produces significantly more coffee than it did 10 to 20 years ago. Unfortunately for the growers, however, this has also been a period in which their total revenues have plunged. In terms of an elasticity, what must be true for these events to have occurred? Illustrate these events with a diagram, indicating the quantity effect and the price effect that gave rise to these events.
Prob 5 11. Worldwide, the average coffee grower has increased the amount of acreage under cultivation over the past few years. The result has been that the average coffee plantation produces significantly more coffee than it did 10 to 20 years ago. Unfortunately for the growers, however, this has also been a period in which their total revenues have plunged. In terms of an elasticity, what must be true for these events to have occurred? Illustrate these events with a diagram, indicating the quantity effect and the price effect that gave rise to these events.Question
According to data from the U.S. Department of Energy, sales of the fuel-efficient Toyota Prius hybrid fell from 158,574 vehicles sold in 2008 to 139,682 in 2009. Over the same period, according to data from the U.S. Energy Information Administration, the average price of regular gasoline fell from $3.27 to $2.35 per gallon. Using the midpoint method, calculate the cross-price elasticity of demand between Toyota Prii (the official plural of “Prius” is “Prii”) and regular gasoline. According to your estimate of the cross-price elasticity, are the two goods complements or substitutes? Does your answer make sense?
Prob 5 12. According to data from the U.S. Department of Energy, sales of the fuel-efficient Toyota Prius hybrid fell from 158,574 vehicles sold in 2008 to 139,682 in 2009. Over the same period, according to data from the U.S. Energy Information Administration, the average price of regular gasoline fell from $3.27 to $2.35 per gallon. Using the midpoint method, calculate the cross-price elasticity of demand between Toyota Prii (the official plural of “Prius” is “Prii”) and regular gasoline. According to your estimate of the cross-price elasticity, are the two goods complements or substitutes? Does your answer make sense?- The United States imposes an excise tax on the sale of domestic airline tickets. Let’s assume that in 2010 the total excise tax was $6.10 per airline ticket (consisting of the $3.60 flight segment tax plus the $2.50 September 11 fee). According to data from the Bureau of Transportation Statistics, in 2010, 630 million passengers traveled on domestic airline trips at an average price of $337 per trip. The accompanying table shows the supply and demand schedules for airline trips. The quantity demanded at the average price of $337 is actual data; the rest is hypothetical.
Price of trip Quantity of trips demanded (millions) Quantity of trips supplied (millions) $337.02 629 686 337.00 630 685 335.00 680 680 330.90 780 630 330.82 900 629 Question
What is the government tax revenue in 2010 from the excise tax?
Prob 5 13a. What is the government tax revenue in 2010 from the excise tax?Question
On January 1, 2011, the total excise tax increased to $6.20 per ticket. What is the quantity of tickets transacted now? What is the average ticket price now? What is the 2011 government tax revenue?
Prob 5 13b. On January 1, 2011, the total excise tax increased to $6.20 per ticket. What is the quantity of tickets transacted now? What is the average ticket price now? What is the 2011 government tax revenue?Question
Does this increase in the excise tax increase or decrease government tax revenue?
Prob 5 13c. Does this increase in the excise tax increase or decrease government tax revenue?
- In 1990, the United States began to levy a tax on sales of luxury cars. For simplicity, assume that the tax was an excise tax of $6,000 per car. The accompanying figure shows hypothetical demand and supply curves for luxury cars.
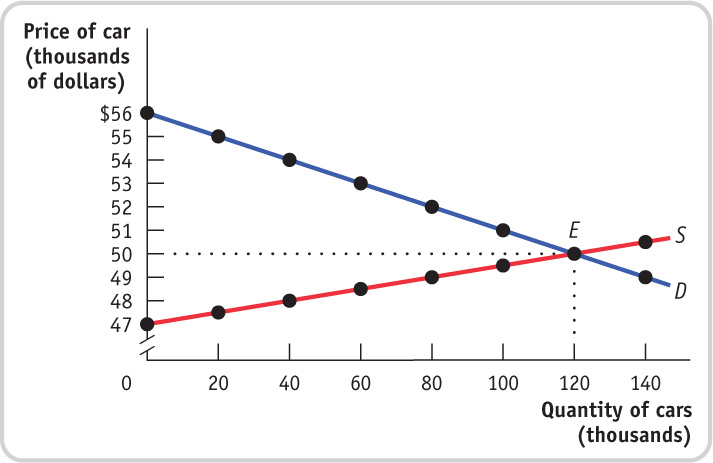
Question
Under the tax, what is the price paid by consumers? What is the price received by producers? What is the government tax revenue from the excise tax?
Over time, the tax on luxury automobiles was slowly phased out (and completely eliminated in 2002). Suppose that the excise tax falls from $6,000 per car to $4,500 per car.Prob 5 14a. Under the tax, what is the price paid by consumers? What is the price received by producers? What is the government tax revenue from the excise tax?
Over time, the tax on luxury automobiles was slowly phased out (and completely eliminated in 2002). Suppose that the excise tax falls from $6,000 per car to $4,500 per car.Question
After the reduction in the excise tax from $6,000 to $4,500 per car, what is the price paid by consumers? What is the price received by producers? What is tax revenue now?
Prob 5 14a. After the reduction in the excise tax from $6,000 to $4,500 per car, what is the price paid by consumers? What is the price received by producers? What is tax revenue now?Question
Compare the tax revenue created by the taxes in parts a and b. What accounts for the change in tax revenue from the reduction in the excise tax?
Prob 5 14a. Compare the tax revenue created by the taxes in parts a and b. What accounts for the change in tax revenue from the reduction in the excise tax?
Page 177
Extend Your Understanding
- The accompanying table lists the cross-price elasticities of demand for several goods, where the percent quantity change is measured for the first good of the pair, and the percent price change is measured for the second good.
Good Cross-price elasticities of demand Air-conditioning units and kilowatts of electricity −0.34 Coke and Pepsi +0.63 High-fuel-consuming sport-utility vehicles (SUVs) and gasoline −0.28 McDonald’s burgers and Burger King burgers +0.82 Butter and margarine +1.54 Question
Explain the sign of each of the cross-price elasticities. What does it imply about the relationship between the two goods in question?
Prob 5 15a. Explain the sign of each of the cross-price elasticities. What does it imply about the relationship between the two goods in question?Question
Compare the absolute values of the cross-price elasticities and explain their magnitudes. For example, why is the cross-price elasticity of McDonald’s burgers and Burger King burgers less than the cross-price elasticity of butter and margarine?
Prob 5 15b. Compare the absolute values of the cross-price elasticities and explain their magnitudes. For example, why is the cross-price elasticity of McDonald’s burgers and Burger King burgers less than the cross-price elasticity of butter and margarine?Question
Use the information in the table to calculate how a 5% increase in the price of Pepsi affects the quantity of Coke demanded.
Prob 5 15c. Use the information in the table to calculate how a 5% increase in the price of Pepsi affects the quantity of Coke demanded.Question
Use the information in the table to calculate how a 10% decrease in the price of gasoline affects the quantity of SUVs demanded.
Prob 5 15d. Use the information in the table to calculate how a 10% decrease in the price of gasoline affects the quantity of SUVs demanded.
Question
A recent report by the U.S. Centers for Disease Control and Prevention (CDC), published in the CDC’s Morbidity and Mortality Weekly Report, studied the effect of an increase in the price of beer on the incidence of new cases of sexually transmitted disease in young adults. In particular, the researchers analyzed the responsiveness of gonorrhea cases to a tax-induced increase in the price of beer. The report concluded that “the … analysis suggested that a beer tax increase of $0.20 per six-pack could reduce overall gonorrhea rates by 8.9%.” Assume that a six-pack costs $5.90 before the price increase. Use the midpoint method to determine the percent increase in the price of a six-pack, and then calculate the cross-price elasticity of demand between beer and incidence of gonorrhea. According to your estimate of this cross-price elasticity of demand, are beer and gonorrhea complements or substitutes?
Prob 5 16. A recent report by the U.S. Centers for Disease Control and Prevention (CDC), published in the CDC’s Morbidity and Mortality Weekly Report, studied the effect of an increase in the price of beer on the incidence of new cases of sexually transmitted disease in young adults. In particular, the researchers analyzed the responsiveness of gonorrhea cases to a tax-induced increase in the price of beer. The report concluded that “the … analysis suggested that a beer tax increase of $0.20 per six-pack could reduce overall gonorrhea rates by 8.9%.” Assume that a six-pack costs $5.90 before the price increase. Use the midpoint method to determine the percent increase in the price of a six-pack, and then calculate the cross-price elasticity of demand between beer and incidence of gonorrhea. According to your estimate of this cross-price elasticity of demand, are beer and gonorrhea complements or substitutes?Question
All states impose excise taxes on gasoline. According to data from the Federal Highway Administration, the state of California imposes an excise tax of $0.18 per gallon of gasoline. In 2009, gasoline sales in California totaled 14.8 billion gallons. What was California’s tax revenue from the gasoline excise tax? If California doubled the excise tax, would tax revenue double? Why or why not?
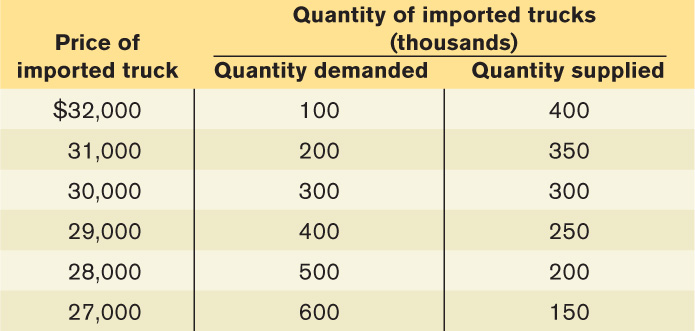
Prob 5 17. All states impose excise taxes on gasoline. According to data from the Federal Highway Administration, the state of California imposes an excise tax of $0.18 per gallon of gasoline. In 2009, gasoline sales in California totaled 14.8 billion gallons. What was California’s tax revenue from the gasoline excise tax? If California doubled the excise tax, would tax revenue double? Why or why not?- The U.S. government would like to help the American auto industry compete against foreign automakers that sell trucks in the United States. It can do this by imposing an excise tax on each foreign truck sold in the United States. The hypothetical pre-tax demand and supply schedules for imported trucks are given in the accompanying table.
Question
In the absence of government interference, what is the equilibrium price of an imported truck? The equilibrium quantity? Illustrate with a diagram.
Prob 5 18a. In the absence of government interference, what is the equilibrium price of an imported truck? The equilibrium quantity? Illustrate with a diagram.Question
Assume that the government imposes an excise tax of $3,000 per imported truck. Illustrate the effect of this excise tax in your diagram from part a. How many imported trucks are now purchased and at what price? How much does the foreign automaker receive per truck?
Prob 5 18b. Assume that the government imposes an excise tax of $3,000 per imported truck. Illustrate the effect of this excise tax in your diagram from part a. How many imported trucks are now purchased and at what price? How much does the foreign automaker receive per truck?Question
Calculate the government revenue raised by the excise tax in part b. Illustrate it on your diagram.
Prob 5 18c. Calculate the government revenue raised by the excise tax in part b. Illustrate it on your diagram.Question
How does the excise tax on imported trucks benefit American automakers? Whom does it hurt? How does inefficiency arise from this government policy?
Prob 5 18d. How does the excise tax on imported trucks benefit American automakers? Whom does it hurt? How does inefficiency arise from this government policy?