Problems
- What type of externality (positive or negative) is present in each of the following examples? Is the marginal social benefit of the activity greater than or equal to the marginal benefit to the individual? Is the marginal social cost of the activity greater than or equal to the marginal cost to the individual? Without intervention, will there be too little or too much (relative to what would be socially optimal) of this activity?
Question
Mr. Chau plants lots of colorful flowers in his front yard.
Prob 9 1a. Mr. Chau plants lots of colorful flowers in his front yard.Question
Your next-door neighbor likes to build bonfires in his backyard, and sparks often drift onto your house.
Prob 9 1b. Your next-door neighbor likes to build bonfires in his backyard, and sparks often drift onto your house.Question
Maija, who lives next to an apple orchard, decides to keep bees to produce honey.
Prob 9 1c. Maija, who lives next to an apple orchard, decides to keep bees to produce honey.Question
Justine buys a large SUV that consumes a lot of gasoline.
Prob 9 1d. Justine buys a large SUV that consumes a lot of gasoline.
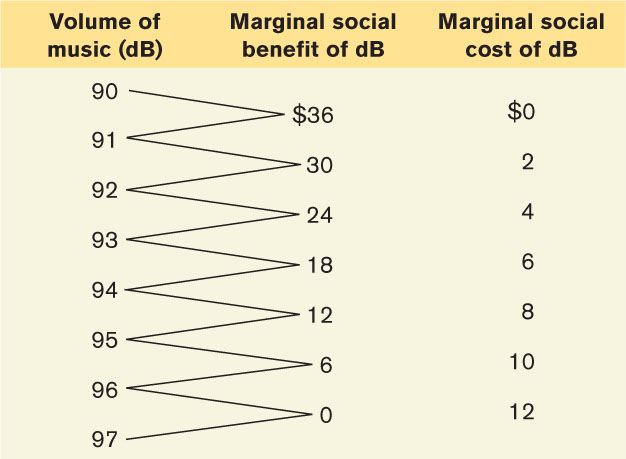
- The loud music coming from the sorority next to your dorm is a negative externality that can be directly quantified. The accompanying table shows the marginal social benefit and the marginal social cost per decibel (dB, a measure of volume) of music.
Question
Draw the marginal social benefit curve and the marginal social cost curve. Use your diagram to determine the socially optimal volume of music.
Prob 9 2a. Draw the marginal social benefit curve and the marginal social cost curve. Use your diagram to determine the socially optimal volume of music.Question
Only the members of the sorority benefit from the music, and they bear none of the cost. Which volume of music will they choose?
Prob 9 2b. Only the members of the sorority benefit from the music, and they bear none of the cost. Which volume of music will they choose?Question
The college imposes a Pigouvian tax of $3 per decibel of music played. From your diagram, determine the volume of music the sorority will now choose.
Prob 9 2c. The college imposes a Pigouvian tax of $3 per decibel of music played. From your diagram, determine the volume of music the sorority will now choose.
- Many dairy farmers in California are adopting a new technology that allows them to produce their own electricity from methane gas captured from animal wastes. (One cow can produce up to 2 kilowatts a day.) This practice reduces the amount of methane gas released into the atmosphere. In addition to reducing their own utility bills, the farmers are allowed to sell any electricity they produce at favorable rates.
Question
Explain how the ability to earn money from capturing and transforming methane gas behaves like a Pigouvian tax on methane gas pollution and can lead dairy farmers to emit the efficient amount of methane gas pollution.
Prob 9 3a. Explain how the ability to earn money from capturing and transforming methane gas behaves like a Pigouvian tax on methane gas pollution and can lead dairy farmers to emit the efficient amount of methane gas pollution.Question
Suppose some dairy farmers have lower costs of transforming methane into electricity than others. Explain how this system leads to an efficient allocation of emissions reduction among farmers.
Prob 9 3b. Suppose some dairy farmers have lower costs of transforming methane into electricity than others. Explain how this system leads to an efficient allocation of emissions reduction among farmers.
Question
According to a report from the U.S. Census Bureau, “the average [lifetime] earnings of a full-time, year round worker with a high school education are about $1.2 million compared with $2.1 million for a college graduate.” This indicates that there is a considerable benefit to a graduate from investing in his or her own education. Tuition at most state universities covers only about two-thirds to three-quarters of the cost, so the state applies a Pigouvian subsidy to college education.
If a Pigouvian subsidy is appropriate, is the externality created by a college education a positive or a negative externality? What does this imply about the differences between the costs and benefits to students compared to social costs and benefits? What are some reasons for the differences?Prob 9 4. According to a report from the U.S. Census Bureau, “the average [lifetime] earnings of a full-time, year round worker with a high school education are about $1.2 million compared with $2.1 million for a college graduate.” This indicates that there is a considerable benefit to a graduate from investing in his or her own education. Tuition at most state universities covers only about two-thirds to three-quarters of the cost, so the state applies a Pigouvian subsidy to college education.
If a Pigouvian subsidy is appropriate, is the externality created by a college education a positive or a negative externality? What does this imply about the differences between the costs and benefits to students compared to social costs and benefits? What are some reasons for the differences?- The city of Falls Church, Virginia, subsidizes trees planted in homeowners’ front yards when they are within 15 feet of the street.
Question
Using concepts in the chapter, explain why a municipality would subsidize trees planted on private property, but near the street.
Prob 9 5a. Using concepts in the chapter, explain why a municipality would subsidize trees planted on private property, but near the street.Question
Draw a diagram similar to Figure 9-4 that shows the marginal social benefit, the marginal social cost, and the optimal Pigouvian subsidy on trees.
Prob 9 5b. Draw a diagram similar to Figure 9-4 that shows the marginal social benefit, the marginal social cost, and the optimal Pigouvian subsidy on trees.
Question
Fishing for sablefish has been so intensive that sablefish were threatened with extinction. After several years of banning such fishing, the government is now proposing to introduce tradable vouchers, each of which entitles its holder to a catch of a certain size. Explain how fishing generates a negative externality and how the voucher scheme may overcome the inefficiency created by this externality.
Prob 9 6. Fishing for sablefish has been so intensive that sablefish were threatened with extinction. After several years of banning such fishing, the government is now proposing to introduce tradable vouchers, each of which entitles its holder to a catch of a certain size. Explain how fishing generates a negative externality and how the voucher scheme may overcome the inefficiency created by this externality.- The two dry-cleaning companies in Collegetown, College Cleaners and Big Green Cleaners, are a major source of air pollution. Together they currently produce 350 units of air pollution, which the town wants to reduce to 200 units. The accompanying table shows the current pollution level produced by each company and each company’s marginal cost of reducing its pollution. The marginal cost is constant.
Companies Initial pollution level (units) Marginal cost of reducing pollution (per unit) College Cleaners 230 $5 Big Green Cleaners 120 $2 Page 303Question
Suppose that Collegetown passes an environmental standards law that limits each company to 100 units of pollution. What would be the total cost to the two companies of each reducing its pollution emissions to 100 units?
Prob 9 7a. Suppose that Collegetown passes an environmental standards law that limits each company to 100 units of pollution. What would be the total cost to the two companies of each reducing its pollution emissions to 100 units?Question
How much is each pollution voucher worth to College Cleaners? To Big Green Cleaners? (That is, how much would each company, at most, be willing to pay for one more voucher?)
Prob 9 7b. How much is each pollution voucher worth to College Cleaners? To Big Green Cleaners? (That is, how much would each company, at most, be willing to pay for one more voucher?)Question
Who will sell vouchers and who will buy them? How many vouchers will be traded?
Prob 9 7c. Who will sell vouchers and who will buy them? How many vouchers will be traded?Question
What is the total cost to the two companies of the pollution controls under this voucher system?
Prob 9 7d. What is the total cost to the two companies of the pollution controls under this voucher system?
Suppose instead that Collegetown issues 100 pollution vouchers to each company, each entitling the company to one unit of pollution, and that these vouchers can be traded.
- The government is involved in providing many goods and services. For each of the goods or services listed, determine whether it is rival or nonrival in consumption and whether it is excludable or nonexcludable. What type of good is it? Without government involvement, would the quantity provided be efficient, inefficiently low, or inefficiently high?
Question
Street signs
Prob 9 8a. Street signsQuestion
Amtrak rail service
Prob 9 8b. Amtrak rail serviceQuestion
Regulations limiting pollution
Prob 9 8c. Regulations limiting pollutionQuestion
A congested interstate highway without tolls
Prob 9 8d. A congested interstate highway without tollsQuestion
A lighthouse on the coast
Prob 9 8e. A lighthouse on the coast
- An economist gives the following advice to a museum director: “You should introduce ‘peak pricing.’ At times when the museum has few visitors, you should admit visitors for free. And at times when the museum has many visitors, you should charge a higher admission fee.”
Question
When the museum is quiet, is it rival or nonrival in consumption? Is it excludable or nonexcludable? What type of good is the museum at those times? What would be the efficient price to charge visitors during that time, and why?
Prob 9 @a. When the museum is quiet, is it rival or nonrival in consumption? Is it excludable or nonexcludable? What type of good is the museum at those times? What would be the efficient price to charge visitors during that time, and why?Question
When the museum is busy, is it rival or nonrival in consumption? Is it excludable or nonexcludable? What type of good is the museum at those times? What would be the efficient price to charge visitors during that time, and why?
Prob 9 @b. When the museum is busy, is it rival or nonrival in consumption? Is it excludable or nonexcludable? What type of good is the museum at those times? What would be the efficient price to charge visitors during that time, and why?
Question
In many planned communities, various aspects of community living are subject to regulation by a homeowners’ association. These rules can regulate house architecture; require snow removal from sidewalks; exclude outdoor equipment, such as backyard swimming pools; require appropriate conduct in shared spaces such as the community clubhouse; and so on. Suppose there has been some conflict in one such community because some homeowners feel that some of the regulations mentioned above are overly intrusive. You have been called in to mediate. Using what you have learned about public goods and common resources, how would you decide what types of regulations are warranted and what types are not?
Prob 9 10. In many planned communities, various aspects of community living are subject to regulation by a homeowners’ association. These rules can regulate house architecture; require snow removal from sidewalks; exclude outdoor equipment, such as backyard swimming pools; require appropriate conduct in shared spaces such as the community clubhouse; and so on. Suppose there has been some conflict in one such community because some homeowners feel that some of the regulations mentioned above are overly intrusive. You have been called in to mediate. Using what you have learned about public goods and common resources, how would you decide what types of regulations are warranted and what types are not?- A residential community has 100 residents who are concerned about security. The accompanying table gives the total cost of hiring a 24-hour security service as well as each individual resident’s total benefit.
Quantity of security guards Total cost Total individual benefit to each resident 0 $0 $0 1 150 10 2 300 16 3 450 18 4 600 19 Question
Explain why the security service is a public good for the residents of the community.
Prob 9 11a. Explain why the security service is a public good for the residents of the community.Question
Calculate the marginal cost, the individual marginal benefit for each resident, and the marginal social benefit.
Prob 9 11b. Calculate the marginal cost, the individual marginal benefit for each resident, and the marginal social benefit.Question
If an individual resident were to decide about hiring and paying for security guards on his or her own, how many guards would that resident hire?
Prob 9 11c. If an individual resident were to decide about hiring and paying for security guards on his or her own, how many guards would that resident hire?Question
If the residents act together, how many security guards will they hire?
Prob 9 11d. If the residents act together, how many security guards will they hire?
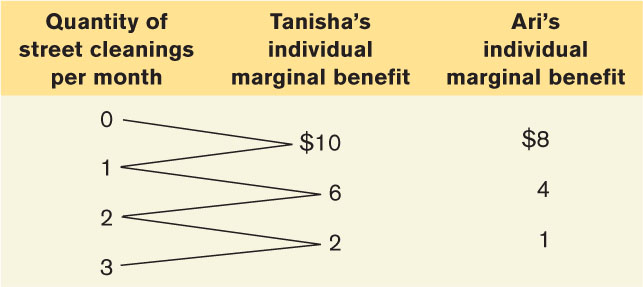
- The accompanying table shows Tanisha’s and Ari’s individual marginal benefit of different amounts of street cleanings per month. Suppose that the marginal cost of street cleanings is constant at $9 each.
Question
If Tanisha had to pay for street cleaning on her own, how many street cleanings would there be?
Prob 9 12a. If Tanisha had to pay for street cleaning on her own, how many street cleanings would there be?Question
Calculate the marginal social benefit of street cleaning. What is the optimal number of street cleanings?
Prob 9 12b. Calculate the marginal social benefit of street cleaning. What is the optimal number of street cleanings?Question
Consider the optimal number of street cleanings. The last street cleaning of that number costs $9. Is Tanisha willing to pay for that last cleaning on her own? Is Ari willing to pay for that last cleaning on his own?
Prob 9 12c. Consider the optimal number of street cleanings. The last street cleaning of that number costs $9. Is Tanisha willing to pay for that last cleaning on her own? Is Ari willing to pay for that last cleaning on his own?
Extend Your Understanding
- Voluntary environmental programs were extremely popular in the United States, Europe, and Japan in the 1990s. Part of their popularity stems from the fact that these programs do not require legislative authority, which is often hard to obtain. The 33/50 program started by the Environmental Protection Agency (EPA) is an example of such a program. With this program, the EPA attempted to reduce industrial emissions of 17 toxic chemicals by providing information on relatively inexpensive methods of pollution control. Companies were asked to voluntarily commit to reducing emissions from their 1988 levels by 33% by 1992 and by 50% by 1995. The program actually met its second target by 1994.Page 304
Question
As in Figure 9-3, draw marginal benefit curves for pollution generated by two plants, A and B, in 1988. Assume that without government intervention, each plant emits the same amount of pollution, but that at all levels of pollution less than this amount, plant A’s marginal benefit of polluting is less than that of plant B. Label the vertical axis “Marginal benefit to individual polluter” and the horizontal axis “Quantity of pollution emissions.” Mark the quantity of pollution each plant produces without government action.
Prob 9 13a. As in Figure 9-3, draw marginal benefit curves for pollution generated by two plants, A and B, in 1988. Assume that without government intervention, each plant emits the same amount of pollution, but that at all levels of pollution less than this amount, plant A’s marginal benefit of polluting is less than that of plant B. Label the vertical axis “Marginal benefit to individual polluter” and the horizontal axis “Quantity of pollution emissions.” Mark the quantity of pollution each plant produces without government action.Question
Do you expect the total quantity of pollution before the program was put in place to have been less than or more than the optimal quantity of pollution? Why?
Prob 9 13b. Do you expect the total quantity of pollution before the program was put in place to have been less than or more than the optimal quantity of pollution? Why?Question
Suppose the plants whose marginal benefit curves you depicted in part a were participants in the 33/50 program. In a replica of your graph from part a, mark targeted levels of pollution in 1995 for the two plants. Which plant was required to reduce emissions more? Was this solution necessarily efficient?
Prob 9 13c. Suppose the plants whose marginal benefit curves you depicted in part a were participants in the 33/50 program. In a replica of your graph from part a, mark targeted levels of pollution in 1995 for the two plants. Which plant was required to reduce emissions more? Was this solution necessarily efficient?Question
What kind of environmental policy does the 33/50 program most closely resemble? What is the main shortcoming of such a policy? Compare it to two other types of environmental policy discussed in this chapter.
Prob 9 13d. What kind of environmental policy does the 33/50 program most closely resemble? What is the main shortcoming of such a policy? Compare it to two other types of environmental policy discussed in this chapter.
- In developing a vaccine for the SARS virus, a pharmaceutical company incurs a very high fixed cost. The marginal cost of delivering the vaccine to patients, however, is negligible (consider it to be equal to zero). The pharmaceutical company holds the exclusive patent to the vaccine. You are a regulator who must decide what price the pharmaceutical company is allowed to charge.
Question
Draw a diagram that shows the price for the vaccine that would arise if the company is unregulated, and label it PM. What is the efficient price for the vaccine? Show the deadweight loss that arises from the price PM.
Prob 9 14a. Draw a diagram that shows the price for the vaccine that would arise if the company is unregulated, and label it PM. What is the efficient price for the vaccine? Show the deadweight loss that arises from the price PM.Question
On another diagram, show the lowest price that the regulator can enforce that would still induce the pharmaceutical company to develop the vaccine. Label it P*. Show the deadweight loss that arises from this price. How does it compare to the deadweight loss that arises from the price PM?
Prob 9 14b. On another diagram, show the lowest price that the regulator can enforce that would still induce the pharmaceutical company to develop the vaccine. Label it P*. Show the deadweight loss that arises from this price. How does it compare to the deadweight loss that arises from the price PM?Question
Suppose you have accurate information about the pharmaceutical company’s fixed cost. How could you use price regulation of the pharmaceutical company, combined with a subsidy to the company, to have the efficient quantity of the vaccine provided at the lowest cost to the government?
Prob 9 14c. Suppose you have accurate information about the pharmaceutical company’s fixed cost. How could you use price regulation of the pharmaceutical company, combined with a subsidy to the company, to have the efficient quantity of the vaccine provided at the lowest cost to the government?