Long-Run Implications of Fiscal Policy
In 2009 the government of Greece ran into a financial wall. Like most other governments in Europe (and the U.S. government, too), the Greek government was running a large budget deficit, which meant that it needed to keep borrowing more funds, both to cover its expenses and to pay off existing loans as they came due. But governments, like companies or individuals, can only borrow if lenders believe there’s a good chance they are willing or able to repay their debts. By 2009 most investors, having lost confidence in Greece’s financial future, were no longer willing to lend to the Greek government. Those few who were willing to lend demanded very high interest rates to compensate them for the risk of loss.
Figure 13-11 compares interest rates on 10-
13-11
Greek and German Long-
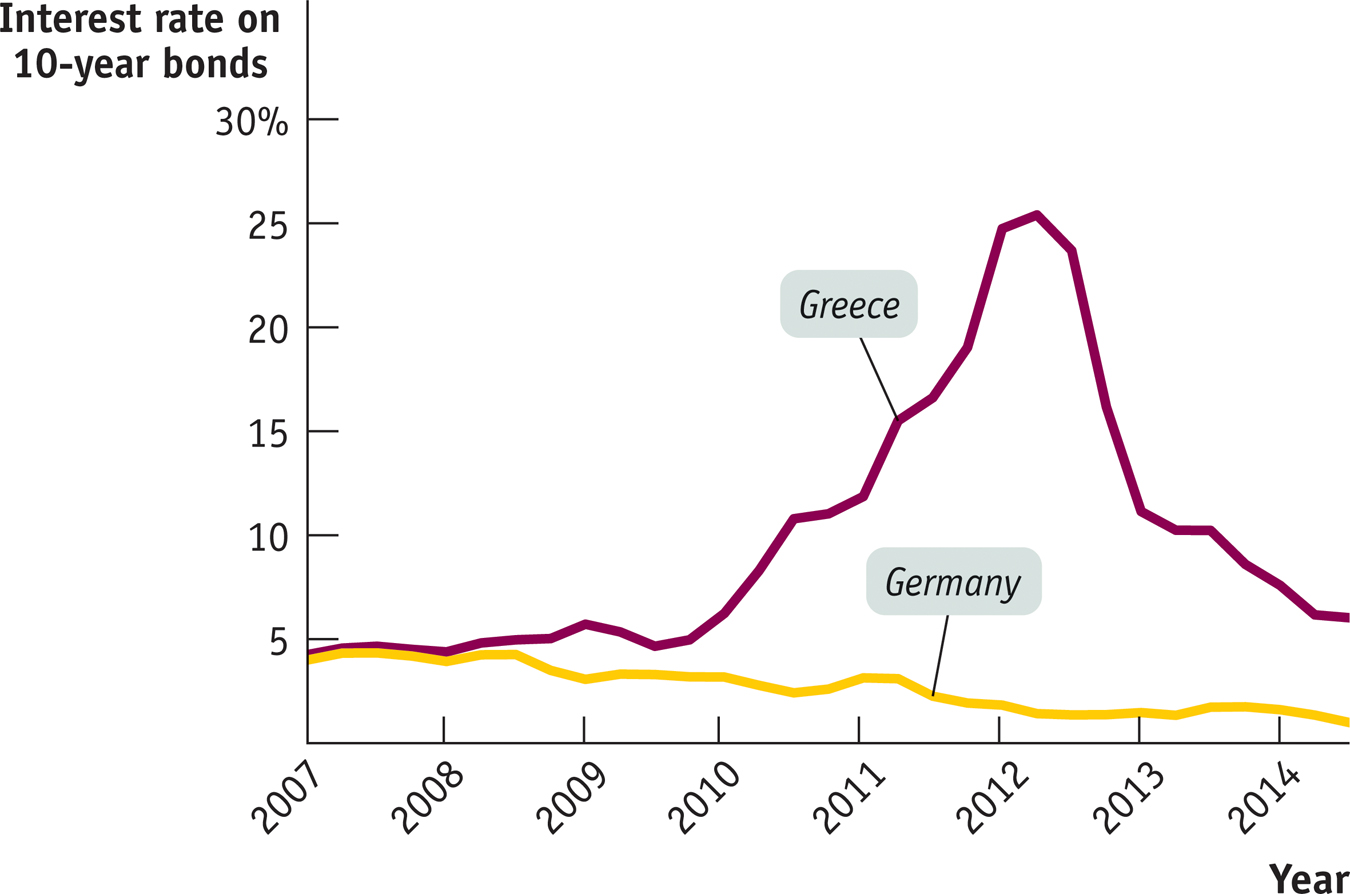
Why was Greece having these problems? Largely because investors had become deeply worried about the level of its debt (in part because it became clear that the Greek government had been using creative accounting to hide just how much debt it had already taken on). Government debt is, after all, a promise to make future payments to lenders. By 2009 it seemed likely that the Greek government had already promised more than it could possibly deliver.
The result was that Greece found itself unable to borrow more from private lenders; it received emergency loans from other European nations and the International Monetary Fund, but these loans came with the requirement that the Greek government make severe spending cuts, which wreaked havoc with its economy, imposed severe economic hardship on Greeks, and led to massive social unrest.
The good news is that by mid-
Despite this good news, however, the crisis in Greece and elsewhere made it clear that no discussion of fiscal policy is complete without taking into account the long-
Deficits, Surpluses, and Debt
When a family spends more than it earns over the course of a year, it has to raise the extra funds either by selling assets or by borrowing. And if a family borrows year after year, it will eventually end up with a lot of debt.
The same is true for governments. With a few exceptions, governments don’t raise large sums by selling assets such as national parkland. Instead, when a government spends more than the tax revenue it receives—
A fiscal year runs from October 1 to September 30 and is labeled according to the calendar year in which it ends.
To interpret the numbers that follow, you need to know a slightly peculiar feature of federal government accounting. For historical reasons, the U.S. government does not keep books by calendar years. Instead, budget totals are kept by fiscal years, which run from October 1 to September 30 and are labeled by the calendar year in which they end. For example, fiscal 2014 began on October 1, 2013, and ended on September 30, 2014.
PITFALLS: DEFICITS VERSUS DEBT
DEFICITS VERSUS DEBT
One common mistake—
A deficit is the difference between the amount of money a government spends and the amount it receives in taxes over a given period—
A debt is the sum of money a government owes at a particular point in time. Debt numbers usually come with a specific date, as in “U.S. public debt at the end of fiscal 2011 was $10.1 trillion.”
Deficits and debt are linked, because government debt grows when governments run deficits. But they aren’t the same thing, and they can even tell different stories. For example, Italy, which found itself in debt trouble in 2011, had a fairly small deficit by historical standards, but it had very high debt, a legacy of past policies.
Public debt is government debt held by individuals and institutions outside the government.
At the end of fiscal 2013, the U.S. federal government had total debt equal to $17.1 trillion. However, part of that debt represented special accounting rules specifying that the federal government as a whole owes funds to certain government programs, especially Social Security. We’ll explain those rules shortly. For now, however, let’s focus on public debt: government debt held by individuals and institutions outside the government. At the end of fiscal 2013, the federal government’s public debt was “only” $12.0 trillion, or 72% of GDP. Federal public debt at the end of 2013 was larger than at the end of 2012 because the government ran a deficit in 2013: a government that runs persistent budget deficits will experience a rising level of public debt. Why is this a problem?
 | The American Way of Debt |
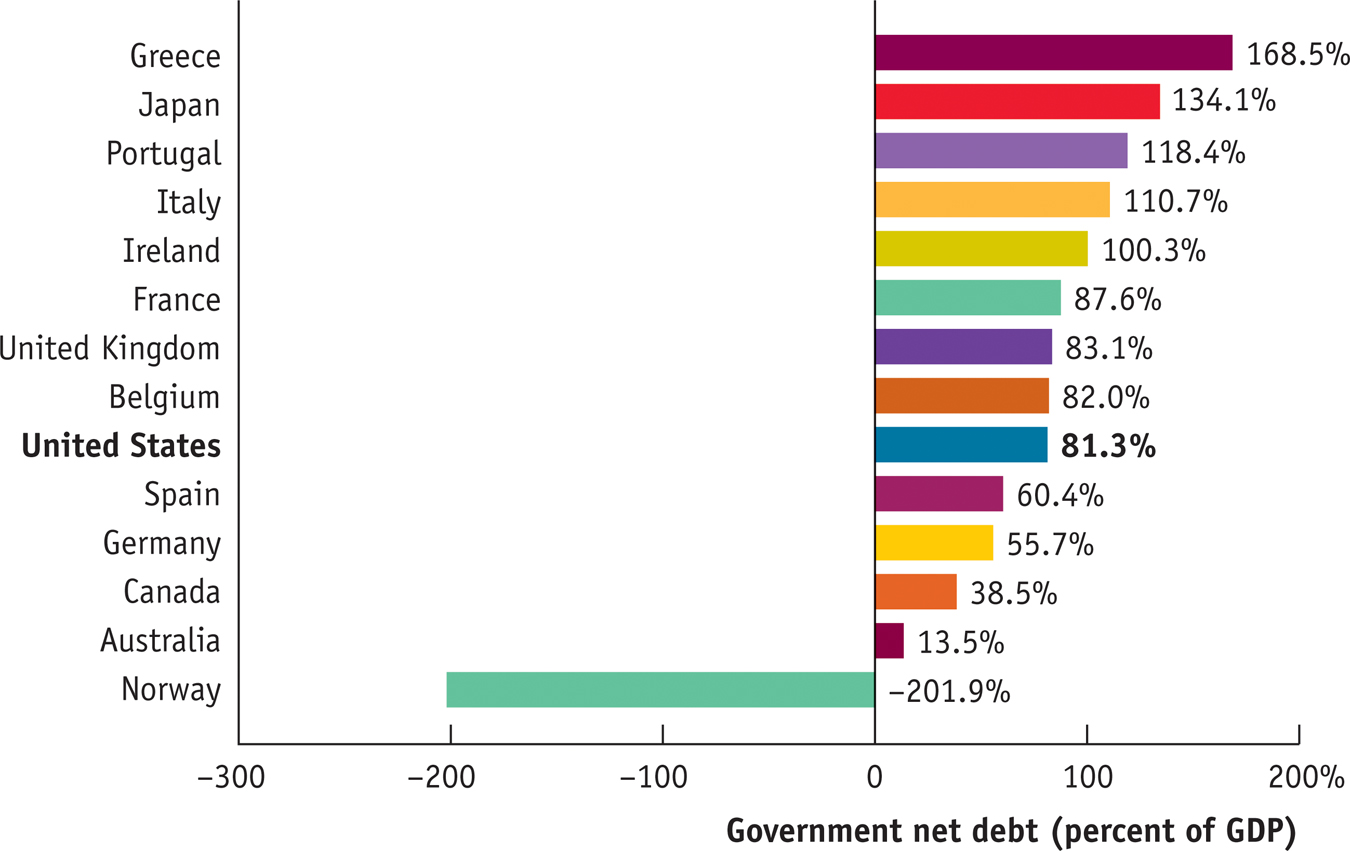
How does the public debt of the United States stack up internationally? In dollar terms, we’re number one—
The figure shows the net public debt of a number of rich countries as a percentage of GDP at the end of 2013. Net public debt is government debt minus any assets governments may have—
It may not surprise you that Greece heads the list, and most of the other high net debt countries are European nations that have been making headlines for their debt problems. Interestingly, however, Japan is also high on the list because it used massive public spending to prop up its economy in the 1990s. Investors, however, still consider Japan a reliable government, so its borrowing costs remain low despite high net debt.
In contrast to the other countries, Norway has a large negative net public debt. What’s going on in Norway? In a word, oil. Norway is the world’s third-
Source: International Monetary Fund.
Problems Posed by Rising Government Debt
There are two reasons to be concerned when a government runs persistent budget deficits. We described one reason in Chapter 10 where the concept of crowding out was defined: when the economy is at full employment and the government borrows funds in the financial markets, it is competing with firms that plan to borrow funds for investment spending. As a result, the government’s borrowing may crowd out private investment spending, increasing interest rates and reducing the economy’s long-
But there’s a second reason: today’s deficits, by increasing the government’s debt, place financial pressure on future budgets. The impact of current deficits on future budgets is straightforward. Like individuals, governments must pay their bills, including interest payments on their accumulated debt. When a government is deeply in debt, those interest payments can be substantial. In fiscal 2013, the U.S. federal government paid 1.3% of GDP—
Other things equal, a government paying large sums in interest must raise more revenue from taxes or spend less than it would otherwise be able to afford—
Americans aren’t used to the idea of government default, but such things do happen. In the 1990s Argentina, a relatively high-
In 2010–
Default creates havoc in a country’s financial markets and badly shakes public confidence in both the government and the economy. Argentina’s debt default was accompanied by a crisis in the country’s banking system and a very severe recession. And even if a highly indebted government avoids default, a heavy debt burden typically forces it to slash spending or raise taxes, politically unpopular measures that can also damage the economy. In some cases, austerity measures intended to reassure lenders that the government can indeed pay end up depressing the economy so much that lender confidence continues to fall.
Some may ask: why can’t a government that has trouble borrowing just print money to pay its bills? Yes, it can if it has its own currency (which the troubled European nations don’t). But printing money to pay the government’s bills can lead to another problem: inflation. In fact, budget problems are the main cause of very severe inflation. Governments do not want to find themselves in a position where the choice is between defaulting on their debts and inflating those debts away by printing money.
Concerns about the long-
Deficits and Debt in Practice
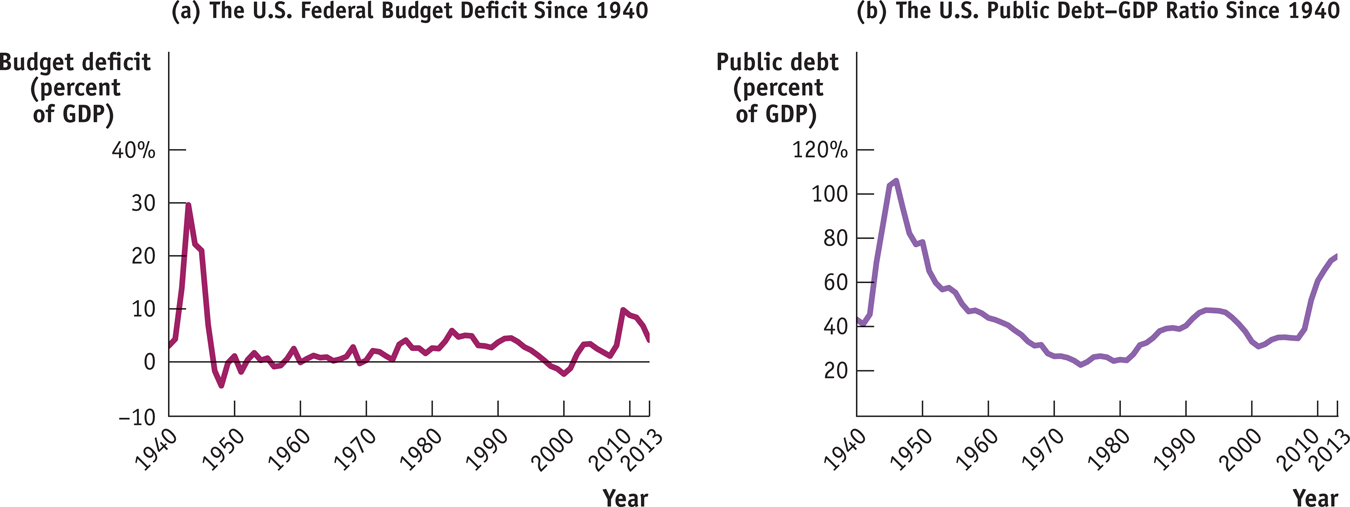
Figure 13-12 shows the U.S. federal government’s budget deficit and its debt evolved from 1940 to 2013. Panel (a) shows the federal deficit as a percentage of GDP. As you can see, the federal government ran huge deficits during World War II. It briefly ran surpluses after the war, but it has normally run deficits ever since, especially after 1980. This seems inconsistent with the advice that governments should offset deficits in bad times with surpluses in good times.
13-12
U.S. Federal Deficits and Debt
The debt–
However, panel (b) of Figure 13-12 shows that for most of the period these persistent deficits didn’t lead to runaway debt. To assess the ability of governments to pay their debt, we use the debt–
What we see from panel (b) is that although the federal debt grew in almost every year, the debt–
What Happened to the Debt from World War II?
As you can see from Figure 13-12, the U.S. government paid for World War II by borrowing on a huge scale. By the war’s end, the public debt was more than 100% of GDP, and many people worried about how it could ever be paid off.
The truth is that it never was paid off. In 1946 public debt was $242 billion; that number dipped slightly in the next few years, as the United States ran postwar budget surpluses, but the government budget went back into deficit in 1950 with the start of the Korean War. By 1962 the public debt was back up to $248 billion.
But by that time nobody was worried about the fiscal health of the U.S. government because the debt–
Still, a government that runs persistent large deficits will have a rising debt–
But when to bring spending in line with revenue was a source of great disagreement. Some argued for fiscal tightening right away; others argued that this tightening should be postponed until the major economies had recovered from their slump.
Implicit Liabilities
Implicit liabilities are spending promises made by governments that are effectively a debt despite the fact that they are not included in the usual debt statistics.
Looking at Figure 13-12, you might be tempted to conclude that until the 2008 crisis struck, the U.S. federal budget was in fairly decent shape: the return to budget deficits after 2001 caused the debt–
The largest implicit liabilities of the U.S. government arise from two transfer programs that principally benefit older Americans: Social Security and Medicare. The third-
The implicit liabilities created by these transfer programs worry fiscal experts. Figure 13-13 shows why. It shows actual spending on Social Security and on Medicare, Medicaid, and CHIP (a program that provides health care coverage to uninsured children) as percentages of GDP from 2000 to 2013, together with Congressional Budget Office projections of spending through 2038. According to these projections, spending on Social Security will rise substantially over the next few decades and spending on the three health care programs will soar. Why?
13-13
Future Demands on the Federal Budget
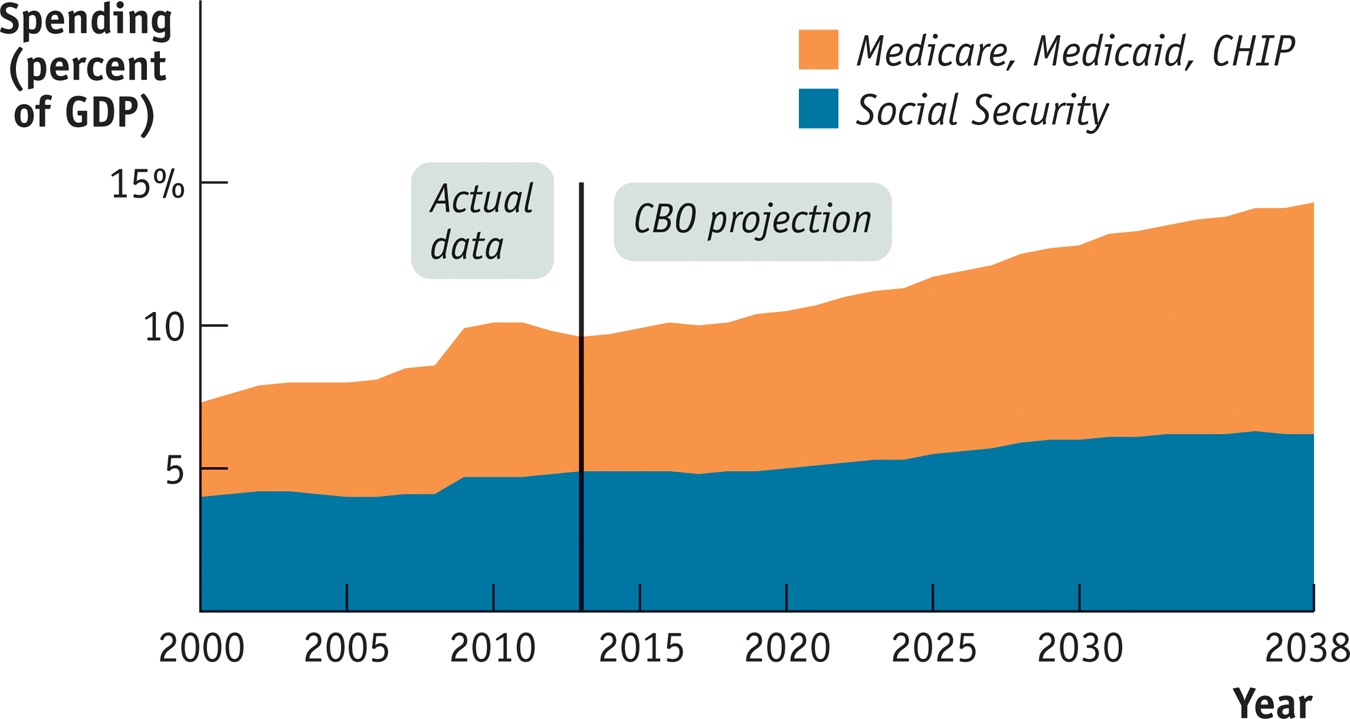
In the case of Social Security, the answer is demography. Social Security is a “pay-
There was a huge surge in the U.S. birth rate between 1946 and 1964, the years of what is commonly called the baby boom. Most baby boomers are currently of working age—
As a result, the ratio of retirees receiving benefits to workers paying into the Social Security system will rise. In 2010 there were 34 retirees receiving benefits for every 100 workers paying into the system. By 2030, according to the Social Security Administration, that number will rise to 46; by 2050, it will rise to 48; and by 2080, that number will be 51. So as baby boomers move into retirement, benefit payments will continue to rise relative to the size of the economy.
The aging of the baby boomers, by itself, poses only a moderately sized long-
To some extent, the implicit liabilities of the U.S. government are already reflected in debt statistics. We mentioned earlier that the government had a total debt of $17 trillion at the end of fiscal 2013 but that only $12 trillion of that total was owed to the public. The main explanation for that discrepancy is that both Social Security and part of Medicare (the hospital insurance program) are supported by dedicated taxes: their expenses are paid out of special taxes on wages. At times, these dedicated taxes yield more revenue than is needed to pay current benefits.
In particular, since the mid-
The money in the trust fund is held in the form of U.S. government bonds, which are included in the $17 trillion in total debt. You could say that there’s something funny about counting bonds in the Social Security trust fund as part of government debt. After all, these bonds are owed by one part of the government (the government outside the Social Security system) to another part of the government (the Social Security system itself). But the debt corresponds to a real, if implicit, liability: promises by the government to pay future retirement benefits.
So many economists argue that the gross debt of $17 trillion, the sum of public debt and government debt held by Social Security and other trust funds, is a more accurate indication of the government’s fiscal health than the smaller amount owed to the public alone.
!worldview! ECONOMICS in Action: Are We Greece?
Are We Greece?
In late 2009, Greece found itself in fiscal crisis, unable to borrow except at very high interest rates, and several other European countries soon found themselves in the same predicament. Meanwhile, the United States was also running large budget deficits and had debt that was high by historical standards. So was America at risk of turning into Greece?
Some influential people thought so, and many dire warnings were issued. For example, in 2010, Alan Greenspan, the former chairman of the Federal Reserve, published an editorial titled “U.S. Debt and the Greece Analogy,” in which he warned that the United States could soon face soaring interest rates. In 2011, Erskine Bowles and Alan Simpson, co-
In fact, U.S. borrowing costs remained low into 2014, with no hint of a cutoff of lending. But was America just lucky?
Not according to a number of economists, especially the Belgian economist Paul De Grauwe, who began arguing in 2011 that the currency in which a country borrows makes a crucial difference. While the United States has a lot of government debt, it’s in dollars; similarly, Britain’s debt is in pounds, and Japan’s debt is in yen. Greece, Spain, and Portugal, by contrast, no longer have their own currencies; their debts are in euros.
Why does this matter? As we’ve explained previously, even the United States can’t always rely on printing money to cover its deficits, because doing so can lead to runaway inflation. But the ability to print dollars does mean that the U.S. government can’t run out of cash. This, in turn, means that we’re not vulnerable to fiscal panic, in which investors fear a sudden default and, by refusing to lend, cause the very default they fear. And De Grauwe argued that the woes of European debtors were largely driven by the risk of such a fiscal panic.
Figure 13-14 shows some evidence for De Grauwe’s view. It compares net debt as a percentage of GDP with interest rates on government bonds for a number of countries in 2012, the worst year of the European debt crisis. The purple markers correspond to countries on the euro—
13-14
Debt and Interest Rates in 2012
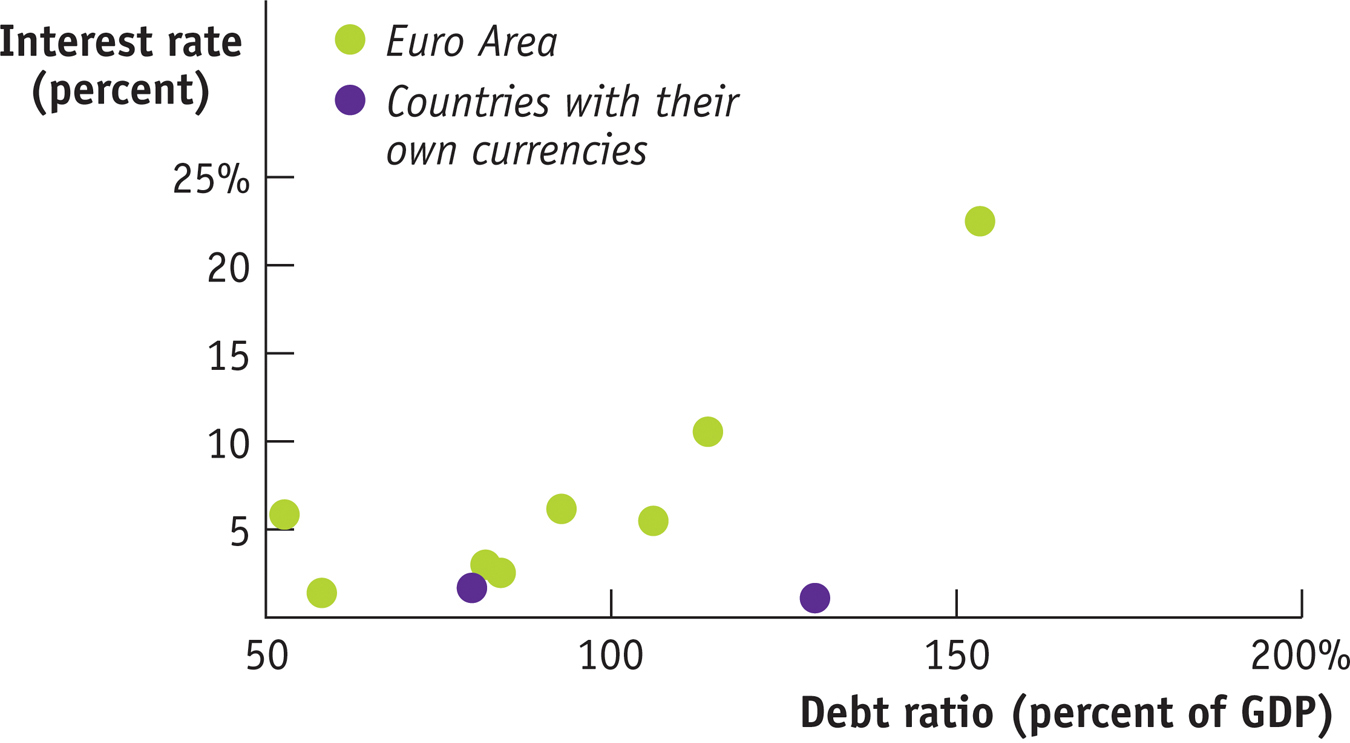
In fact, as we’ve seen, even within the euro area, borrowing costs of high-
In any case, by 2014, warnings that the United States was about to turn into Greece had mostly vanished. There are many risks facing America, but that doesn’t seem to be anywhere near the top of the list.
Quick Review
Persistent budget deficits lead to increases in public debt.
Rising public debt can lead to government default. In less extreme cases, it can crowd out investment spending, reducing long-
run growth. This suggests that budget deficits in bad fiscal years should be offset with budget surpluses in good fiscal years. A widely used indicator of fiscal health is the debt–
GDP ratio . A country with rising GDP can have a stable or falling debt–GDP ratio even if it runs budget deficits if GDP is growing faster than the debt. In addition to their official public debt, modern governments have implicit liabilities. The U.S. government has large implicit liabilities in the form of Social Security, Medicare, and Medicaid.
13-4
Question 13.9
Explain how each of the following events would affect the public debt or implicit liabilities of the U.S. government, other things equal. Would the public debt or implicit liabilities be greater or smaller?
A higher growth rate of real GDP
A higher growth rate of real GDP implies that tax revenue will increase. If government spending remains constant and the government runs a budget surplus, the size of the public debt will be less than it would otherwise have been.
Retirees live longer
If retirees live longer, the average age of the population increases. As a result, the implicit liabilities of the government increase because spending on programs for older Americans, such as Social Security and Medicare, will rise.
A decrease in tax revenue
A decrease in tax revenue without offsetting reductions in government spending will cause the public debt to increase.
Government borrowing to pay interest on its current public debt
Public debt will increase as a result of government borrowing to pay interest on its current public debt.
Question 13.10
Suppose the economy is in a slump and the current public debt is quite large. Explain the trade-
off of short- run versus long- run objectives that policy makers face when deciding whether or not to engage in deficit spending. In order to stimulate the economy in the short run, the government can use fiscal policy to increase real GDP. This entails borrowing, increasing the size of the public debt further and leading to undesirable consequences: in extreme cases, governments can be forced to default on their debts. Even in less extreme cases, a large public debt is undesirable because government borrowing crowds out borrowing for private investment spending. This reduces the amount of investment spending, reducing the long-run growth of the economy.
Question 13.11
Explain how a policy of fiscal austerity can make it more likely that a government is unable to pay its debts.
Fiscal austerity is the same as a contractionary fiscal policy. It reduces government spending, which in turn reduces income and reduces tax revenue. With less tax revenue, the government is less able to pay its debts. Also, a failing economy causes lenders to have less confidence that a government is able to pay its debts and leads them to raise interest rates on the debt. Higher interest rates on the debt make it even less likely the government can repay.
Solutions appear at back of book.
Here Comes the Sun

The Solana power plant, which opened in 2013, covers 3 square miles of the Arizona desert in Gila Bend, about 70 miles from Phoenix. Whereas most solar installations rely on photovoltaic panels that convert light directly into electricity, Solana uses a system of mirrors to concentrate the sun’s heat on black pipes, which convey that heat to tanks of molten salt. The heat in the salt is, in turn, used to generate electricity. The advantage of this arrangement is that the plant can keep generating power long after the sun has gone down, greatly enhancing its efficiency.
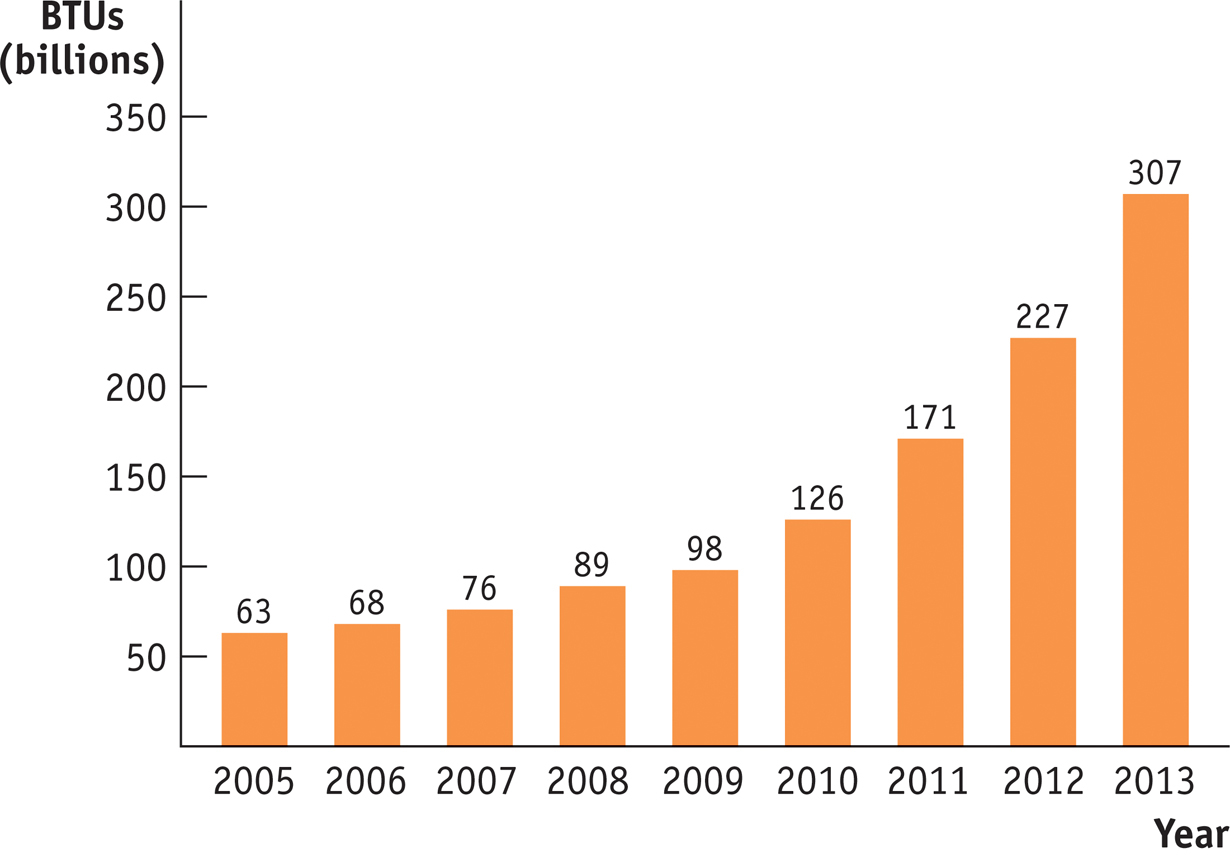
Solana is one of only a small number of concentrated thermal solar plants operating or under construction, and as Figure 13-15 shows, solar power has been rapidly rising in importance, with the amount of electricity generated by solar almost quadrupling between 2008 and 2013. There are a number of reasons for this sudden rise, but the Obama stimulus—
13-15
The Solar Sunrise, 2005–
While Solana is a good example of stimulus spending at work, it is also a good example of why such spending tends to be politically difficult. There were many protests over federal loans to a non-
In terms of the goals of the stimulus, however, Solana seems to have done what it was supposed to: it generated jobs at a time when borrowing was cheap and many construction workers were unemployed.
QUESTIONS FOR THOUGHT
Question 13.12
How did the political reaction to government funding for the Solana project differ from the reaction to more conventional government spending projects such as roads and schools? What does the case tell us about how to assess the value of a fiscal stimulus project?
How did the political reaction to government funding for the Solana project differ from the reaction to more conventional government spending projects such as roads and schools? What does the case tell us about how to assess the value of a fiscal stimulus project?Question 13.13
In the chapter we talked about the problem of lags in discretionary fiscal policy. What does the Solana case tell us about this issue?
In the chapter we talked about the problem of lags in discretionary fiscal policy. What does the Solana case tell us about this issue?Question 13.14
Is the depth of a recession a good or a bad time to undertake an energy project? Why or why not?
Is the depth of a recession a good or a bad time to undertake an energy project? Why or why not?